## Chart: LM Loss vs. PFLOP/s-days for MoBA and Full Attention Projections
### Overview
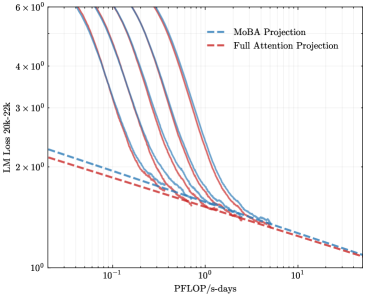
The image is a line chart comparing the Language Model (LM) Loss for MoBA Projection and Full Attention Projection across varying computational costs measured in PFLOP/s-days. The y-axis represents LM Loss from 20k to 22k, and the x-axis represents PFLOP/s-days. Multiple lines are plotted for each projection type, showing the trend of loss reduction as computational cost increases.
### Components/Axes
* **Title:** Implicitly, the chart compares LM Loss vs. PFLOP/s-days for MoBA and Full Attention Projections.
* **X-axis:** PFLOP/s-days (PetaFLOPS per second-days). The scale is logarithmic, with markers at 10<sup>-1</sup>, 10<sup>0</sup> (1), and 10<sup>1</sup> (10).
* **Y-axis:** LM Loss 20k-22k. The scale is logarithmic, with markers at 2 x 10<sup>0</sup> (2), 3 x 10<sup>0</sup> (3), 4 x 10<sup>0</sup> (4), and 6 x 10<sup>0</sup> (6).
* **Legend:** Located at the top-right of the chart.
* **Blue dashed line:** MoBA Projection
* **Red dashed line:** Full Attention Projection
### Detailed Analysis
* **MoBA Projection (Blue dashed line):** The MoBA Projection line starts at approximately 2.2 x 10<sup>0</sup> LM Loss at 0.05 PFLOP/s-days and decreases to approximately 1.2 x 10<sup>0</sup> LM Loss at 20 PFLOP/s-days. The trend is a decreasing loss with increasing computational cost.
* **Full Attention Projection (Red dashed line):** The Full Attention Projection line starts at approximately 2.0 x 10<sup>0</sup> LM Loss at 0.05 PFLOP/s-days and decreases to approximately 1.1 x 10<sup>0</sup> LM Loss at 20 PFLOP/s-days. The trend is a decreasing loss with increasing computational cost.
* **Multiple Lines (Solid Blue and Red):** There are multiple solid blue and red lines that represent different runs or variations of the MoBA and Full Attention projections. These lines generally show a similar decreasing trend in LM Loss as computational cost increases. The solid lines start at higher LM Loss values (between 4 x 10<sup>0</sup> and 6 x 10<sup>0</sup>) at low PFLOP/s-days (around 0.05) and converge towards the dashed lines as PFLOP/s-days increases.
### Key Observations
* Both MoBA and Full Attention Projections show a decrease in LM Loss as computational cost (PFLOP/s-days) increases.
* The solid lines, representing different runs or variations, start with higher LM Loss values but converge towards the dashed lines as computational cost increases.
* The dashed lines (MoBA and Full Attention) are relatively close to each other, suggesting similar performance in terms of LM Loss reduction for higher computational costs.
### Interpretation
The chart suggests that both MoBA and Full Attention Projections are effective in reducing LM Loss as computational cost increases. The convergence of the solid lines towards the dashed lines indicates that the initial variations in LM Loss diminish with higher computational investment. The proximity of the MoBA and Full Attention dashed lines at higher PFLOP/s-days suggests that their performance becomes comparable in that regime. The multiple solid lines likely represent different experimental runs or hyperparameter settings, and their convergence indicates a degree of robustness in the models' performance as computational resources are scaled up.