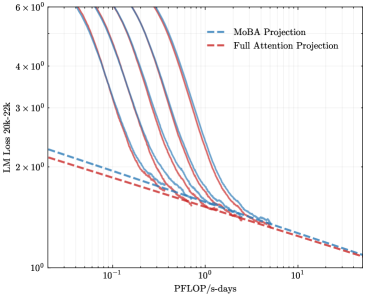
## Chart: LM Loss vs. PFLOP/s-days
### Overview
The image presents a line chart comparing the Language Model (LM) Loss against PFLOP/s-days for two projection methods: MoBA Projection and Full Attention Projection. Multiple lines are plotted for each method, likely representing different runs or configurations. The chart is designed to visualize the trade-off between computational cost (PFLOP/s-days) and model performance (LM Loss).
### Components/Axes
* **X-axis:** PFLOP/s-days. Scale is logarithmic, ranging from approximately 10<sup>-1</sup> to 10<sup>1</sup>.
* **Y-axis:** LM Loss 20k-22k. Scale is logarithmic, ranging from approximately 10<sup>0</sup> to 10<sup>6</sup>.
* **Legend:** Located in the top-right corner.
* MoBA Projection (Blue dashed lines)
* Full Attention Projection (Red dashed lines)
* **Data Series:** Multiple lines for each projection method. There are approximately 6 lines for each method.
### Detailed Analysis
**MoBA Projection (Blue dashed lines):**
The lines generally slope downward, indicating that as PFLOP/s-days increase, the LM Loss decreases.
* Line 1: Starts at approximately LM Loss = 2.5 x 10<sup>2</sup> at PFLOP/s-days = 10<sup>-1</sup>, decreasing to approximately LM Loss = 1.5 x 10<sup>1</sup> at PFLOP/s-days = 10<sup>1</sup>.
* Line 2: Starts at approximately LM Loss = 2.0 x 10<sup>2</sup> at PFLOP/s-days = 10<sup>-1</sup>, decreasing to approximately LM Loss = 1.0 x 10<sup>1</sup> at PFLOP/s-days = 10<sup>1</sup>.
* Line 3: Starts at approximately LM Loss = 1.8 x 10<sup>2</sup> at PFLOP/s-days = 10<sup>-1</sup>, decreasing to approximately LM Loss = 8 x 10<sup>0</sup> at PFLOP/s-days = 10<sup>1</sup>.
* Line 4: Starts at approximately LM Loss = 1.5 x 10<sup>2</sup> at PFLOP/s-days = 10<sup>-1</sup>, decreasing to approximately LM Loss = 6 x 10<sup>0</sup> at PFLOP/s-days = 10<sup>1</sup>.
* Line 5: Starts at approximately LM Loss = 1.2 x 10<sup>2</sup> at PFLOP/s-days = 10<sup>-1</sup>, decreasing to approximately LM Loss = 5 x 10<sup>0</sup> at PFLOP/s-days = 10<sup>1</sup>.
* Line 6: Starts at approximately LM Loss = 1.0 x 10<sup>2</sup> at PFLOP/s-days = 10<sup>-1</sup>, decreasing to approximately LM Loss = 4 x 10<sup>0</sup> at PFLOP/s-days = 10<sup>1</sup>.
**Full Attention Projection (Red dashed lines):**
The lines also slope downward, but generally start at higher LM Loss values and decrease more rapidly than the MoBA Projection lines.
* Line 1: Starts at approximately LM Loss = 5.0 x 10<sup>2</sup> at PFLOP/s-days = 10<sup>-1</sup>, decreasing to approximately LM Loss = 2.0 x 10<sup>1</sup> at PFLOP/s-days = 10<sup>1</sup>.
* Line 2: Starts at approximately LM Loss = 4.5 x 10<sup>2</sup> at PFLOP/s-days = 10<sup>-1</sup>, decreasing to approximately LM Loss = 1.8 x 10<sup>1</sup> at PFLOP/s-days = 10<sup>1</sup>.
* Line 3: Starts at approximately LM Loss = 4.0 x 10<sup>2</sup> at PFLOP/s-days = 10<sup>-1</sup>, decreasing to approximately LM Loss = 1.6 x 10<sup>1</sup> at PFLOP/s-days = 10<sup>1</sup>.
* Line 4: Starts at approximately LM Loss = 3.5 x 10<sup>2</sup> at PFLOP/s-days = 10<sup>-1</sup>, decreasing to approximately LM Loss = 1.4 x 10<sup>1</sup> at PFLOP/s-days = 10<sup>1</sup>.
* Line 5: Starts at approximately LM Loss = 3.0 x 10<sup>2</sup> at PFLOP/s-days = 10<sup>-1</sup>, decreasing to approximately LM Loss = 1.2 x 10<sup>1</sup> at PFLOP/s-days = 10<sup>1</sup>.
* Line 6: Starts at approximately LM Loss = 2.5 x 10<sup>2</sup> at PFLOP/s-days = 10<sup>-1</sup>, decreasing to approximately LM Loss = 1.0 x 10<sup>1</sup> at PFLOP/s-days = 10<sup>1</sup>.
### Key Observations
* Both projection methods demonstrate a clear negative correlation between PFLOP/s-days and LM Loss.
* The Full Attention Projection generally starts with higher loss values but exhibits a steeper decrease in loss compared to the MoBA Projection, especially at lower PFLOP/s-days values.
* There is some variance between the lines within each projection method, suggesting that the results are not entirely consistent and may be influenced by other factors.
* The logarithmic scales on both axes compress the data, making it difficult to discern precise differences in loss values at higher PFLOP/s-days.
### Interpretation
The chart suggests that increasing computational resources (PFLOP/s-days) leads to improved language model performance (lower LM Loss) for both MoBA and Full Attention Projection methods. However, the Full Attention Projection appears to be more sensitive to computational resources, achieving a greater reduction in loss for a given increase in PFLOP/s-days, particularly at lower computational budgets. This could indicate that Full Attention Projection is more computationally demanding but offers faster convergence to lower loss values. The variance between the lines within each method suggests that factors beyond PFLOP/s-days, such as initialization, data sampling, or hyperparameter settings, also play a significant role in determining the final LM Loss. The use of logarithmic scales implies that the researchers are interested in capturing the relative changes in loss and computational cost across a wide range of values, rather than focusing on absolute differences. The "20k-22k" annotation on the Y-axis suggests that the LM Loss is being measured on a specific subset of the training data or a particular evaluation metric.