## Scatter Plot: GFLOPS vs. Parameters for CNN and Transformer Architectures
### Overview
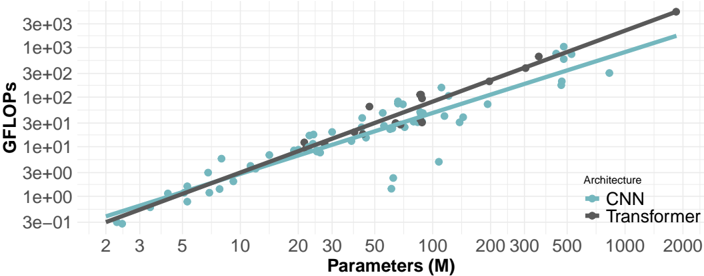
The image is a scatter plot comparing the performance (GFLOPS) of Convolutional Neural Networks (CNN) and Transformer architectures against the number of parameters (in millions). Both axes are logarithmically scaled. The plot shows a general trend of increasing GFLOPS with increasing parameters for both architectures, with Transformer models generally achieving higher GFLOPS for a given number of parameters compared to CNNs.
### Components/Axes
* **X-axis:** Parameters (M), logarithmically scaled from approximately 2 to 2000. Axis markers are present at 2, 3, 5, 10, 20, 30, 50, 100, 200, 300, 500, 1000, and 2000.
* **Y-axis:** GFLOPS, logarithmically scaled from approximately 3e-01 (0.3) to 3e+03 (3000). Axis markers are present at 3e-01, 1e+00, 3e+00, 1e+01, 3e+01, 1e+02, 3e+02, 1e+03, and 3e+03.
* **Legend:** Located in the bottom-right corner.
* CNN: Represented by teal-colored data points and a teal trend line.
* Transformer: Represented by dark gray data points and a dark gray trend line.
### Detailed Analysis
* **CNN (Teal):**
* Trend: The GFLOPS generally increase with the number of parameters.
* Data Points:
* At 2M parameters, GFLOPS is approximately 0.3.
* At 10M parameters, GFLOPS is approximately 3.
* At 50M parameters, GFLOPS ranges from 5 to 20.
* At 200M parameters, GFLOPS is approximately 50.
* At 1000M parameters, GFLOPS is approximately 200.
* **Transformer (Dark Gray):**
* Trend: The GFLOPS generally increase with the number of parameters.
* Data Points:
* At 2M parameters, GFLOPS is approximately 0.3.
* At 10M parameters, GFLOPS is approximately 5.
* At 50M parameters, GFLOPS ranges from 10 to 30.
* At 200M parameters, GFLOPS is approximately 100.
* At 1000M parameters, GFLOPS is approximately 500.
### Key Observations
* For a given number of parameters, Transformer models tend to achieve higher GFLOPS compared to CNN models.
* Both CNN and Transformer architectures exhibit a positive correlation between the number of parameters and GFLOPS.
* There is some scatter in the data, indicating that factors other than the number of parameters also influence GFLOPS.
### Interpretation
The scatter plot suggests that Transformer architectures are generally more efficient in terms of GFLOPS per parameter compared to CNNs. This could be attributed to the architectural differences between the two, such as the attention mechanism in Transformers, which allows for more efficient information processing. The positive correlation between parameters and GFLOPS indicates that increasing the model size generally leads to improved performance, but the scatter suggests that architectural choices and other factors play a significant role. The logarithmic scaling of both axes highlights the exponential relationship between model size and performance.