## Scatter Plot: Computational Cost (GFLOPs) vs. Model Parameters (M) for CNN and Transformer Architectures
### Overview
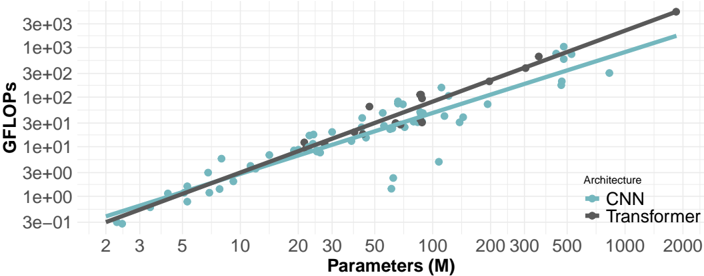
The image is a scatter plot on a log-log scale comparing the computational cost, measured in GFLOPs (Giga Floating-Point Operations per Second), against the number of model parameters (in millions) for two types of neural network architectures: Convolutional Neural Networks (CNN) and Transformers. The plot includes best-fit trend lines for each architecture.
### Components/Axes
* **X-Axis (Horizontal):**
* **Title:** `Parameters (M)`
* **Scale:** Logarithmic.
* **Tick Marks (Approximate):** 2, 3, 5, 10, 20, 30, 50, 100, 200, 300, 500, 1000, 2000.
* **Y-Axis (Vertical):**
* **Title:** `GFLOPs`
* **Scale:** Logarithmic.
* **Tick Marks (Approximate):** 3e-01 (0.3), 1e+00 (1), 3e+00 (3), 1e+01 (10), 3e+01 (30), 1e+02 (100), 3e+02 (300), 1e+03 (1000), 3e+03 (3000).
* **Legend:**
* **Position:** Bottom-right corner of the chart area.
* **Title:** `Architecture`
* **Series 1:** `CNN` - Represented by teal-colored circular dots and a solid teal trend line.
* **Series 2:** `Transformer` - Represented by dark gray circular dots and a solid dark gray trend line.
### Detailed Analysis
The plot displays a clear positive correlation between the number of parameters and computational cost (GFLOPs) for both architectures. The relationship appears linear on this log-log scale, indicating a power-law relationship (GFLOPs ∝ Parameters^k).
**Trend Verification & Data Points:**
* **CNN (Teal):** The data points and trend line show a steady upward slope. The trend line starts near (2M params, ~0.4 GFLOPs) and extends to approximately (2000M params, ~2000 GFLOPs). The scatter of points around the line is moderate, with some notable outliers below the trend line, particularly in the 50M-200M parameter range.
* **Transformer (Dark Gray):** The data points and trend line also slope upward but with a steeper gradient than the CNN line. The trend line starts near (20M params, ~10 GFLOPs) and extends to approximately (2000M params, ~3000 GFLOPs). The data points for Transformers are less numerous but cluster more tightly around their trend line compared to CNNs.
**Key Data Point Approximations (from trend lines):**
* At **100M Parameters**: CNN ≈ 100 GFLOPs; Transformer ≈ 200 GFLOPs.
* At **500M Parameters**: CNN ≈ 600 GFLOPs; Transformer ≈ 1200 GFLOPs.
* At **1000M (1B) Parameters**: CNN ≈ 1200 GFLOPs; Transformer ≈ 2000 GFLOPs.
### Key Observations
1. **Architectural Efficiency Gap:** For a given number of parameters, Transformer models consistently require more GFLOPs (higher computational cost) than CNN models. The gap widens as model size increases, evidenced by the steeper slope of the Transformer trend line.
2. **Power-Law Scaling:** Both architectures follow a power-law scaling between parameters and compute, a common observation in deep learning scaling laws.
3. **CNN Variance:** The CNN data shows greater variance, with several models achieving significantly lower GFLOPs than the trend would predict for their parameter count (e.g., points near 100M params and 10 GFLOPs). This could indicate more efficient architectural variants or pruning.
4. **Data Distribution:** The CNN data spans a wider range of model sizes (from ~2M to ~1000M+ params), while the Transformer data points are concentrated in the mid-to-large range (~20M to ~1000M+ params).
### Interpretation
This chart visually quantifies a fundamental trade-off in modern deep learning: the **computational cost of scale**. It demonstrates that simply counting parameters is insufficient to predict training or inference cost; the architecture type is a critical factor.
* **What the data suggests:** Transformers, while powerful, are more "compute-hungry" per parameter than CNNs. This aligns with known characteristics of self-attention mechanisms, which have quadratic complexity with respect to sequence length, compared to the more localized operations in CNNs.
* **Relationship between elements:** The plot establishes a direct, quantifiable relationship between model size (parameters) and resource requirement (GFLOPs). The diverging trend lines highlight that this relationship is architecture-dependent.
* **Implications:** For practitioners, this means that deploying a 1B-parameter Transformer will likely require more powerful hardware (for faster computation) or will run slower than a 1B-parameter CNN. The chart provides a rough benchmark for estimating the computational budget needed when scaling models of different types. The outliers among CNNs suggest there is room for architectural innovation to improve parameter efficiency.