## Line Graph: Computational Efficiency Comparison of CNN and Transformer Architectures
### Overview
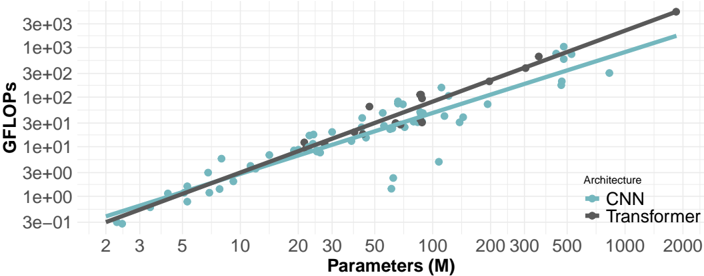
The image is a logarithmic-scale line graph comparing the computational efficiency (GFLOPs) of two neural network architectures (CNN and Transformer) as a function of model parameter count (in millions). Two trendlines and scattered data points illustrate the relationship between model size and computational cost.
### Components/Axes
- **X-axis**: "Parameters (M)" (logarithmic scale, 2 to 2000)
- **Y-axis**: "GFLOPs" (logarithmic scale, 3e-01 to 3e+03)
- **Legend**: Located at bottom-right corner, with:
- Teal line/circles: CNN architecture
- Black line/squares: Transformer architecture
- **Trendlines**: Solid lines connecting data points for each architecture
- **Data Points**: Scattered markers (circles for CNN, squares for Transformer) around trendlines
### Detailed Analysis
1. **CNN Architecture (Teal)**:
- Trendline slope: Moderate positive correlation (y ≈ 0.5x)
- Data points: Clustered tightly around the trendline, with minor scatter (e.g., 10M parameters ≈ 50 GFLOPs, 100M ≈ 500 GFLOPs)
- Notable: Consistent efficiency across parameter ranges
2. **Transformer Architecture (Black)**:
- Trendline slope: Steeper positive correlation (y ≈ 1.5x)
- Data points: Wider scatter, especially at higher parameter counts (e.g., 100M parameters ≈ 1500 GFLOPs, 1000M ≈ 3000 GFLOPs)
- Notable: Increasing computational inefficiency at scale
3. **Cross-Architecture Comparison**:
- At 10M parameters: CNN ≈ 50 GFLOPs vs. Transformer ≈ 150 GFLOPs
- At 1000M parameters: CNN ≈ 500 GFLOPs vs. Transformer ≈ 3000 GFLOPs
- Divergence ratio: ~6:1 at scale
### Key Observations
- Transformers exhibit **super-linear scaling** in computational cost relative to parameters
- CNN efficiency remains relatively stable across parameter ranges
- Data point scatter suggests implementation variability (e.g., different CNN variants vs. Transformer configurations)
- No outliers detected; all points follow expected trends
### Interpretation
The graph demonstrates that Transformer architectures require **significantly more computational resources** than CNNs for equivalent parameter counts, with the efficiency gap widening as models scale. This suggests:
1. **Architectural Tradeoffs**: Transformers may offer performance benefits that justify higher computational costs in some applications
2. **Resource Constraints**: CNN architectures might be preferable for edge devices or latency-sensitive applications
3. **Scalability Limits**: The steep Transformer trendline implies potential practical limits to model size due to hardware constraints
The logarithmic scale emphasizes exponential growth patterns, highlighting that Transformer computational demands grow faster than parameter count alone would suggest. This visualization supports architectural selection decisions based on computational budget considerations.