# Technical Document Extraction
## Image Description
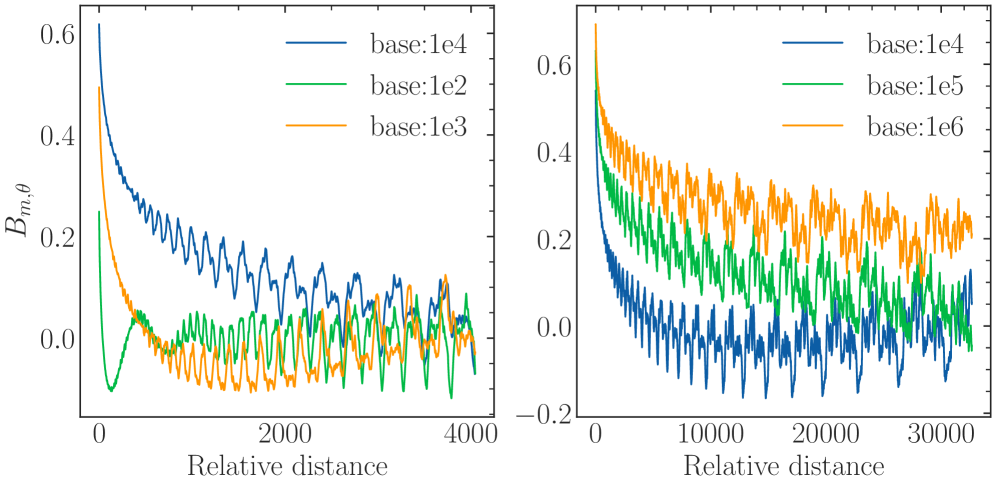
The image contains two side-by-side line charts comparing the parameter **B_m,θ** across varying **Relative distance**. Each chart includes three data series distinguished by base values (1e2, 1e3, 1e4 for the left chart; 1e4, 1e5, 1e6 for the right chart). The charts exhibit oscillatory behavior with decaying amplitudes.
---
## Chart 1: Left Panel
### Axis Labels
- **X-axis**: Relative distance (0 to 4000)
- **Y-axis**: B_m,θ (-0.2 to 0.6)
### Legend
- **Location**: Right side of the chart
- **Entries**:
- Blue line: base:1e4
- Green line: base:1e2
- Orange line: base:1e3
### Data Series Trends
1. **Blue (base:1e4)**:
- Starts at ~0.6, steeply declines to ~0.1 by x=2000.
- Oscillations decrease in amplitude over time.
- Final value at x=4000: ~0.05.
2. **Green (base:1e2)**:
- Begins at ~0.4, declines to ~0.05 by x=2000.
- Oscillations are smaller in amplitude compared to blue.
- Final value at x=4000: ~0.02.
3. **Orange (base:1e3)**:
- Starts at ~0.5, declines to ~0.03 by x=2000.
- Oscillations are intermediate in amplitude.
- Final value at x=4000: ~0.04.
### Spatial Grounding
- Legend colors match line colors exactly:
- Blue (1e4) aligns with the highest initial value.
- Green (1e2) aligns with the lowest initial value.
- Orange (1e3) aligns with intermediate initial value.
---
## Chart 2: Right Panel
### Axis Labels
- **X-axis**: Relative distance (0 to 30,000)
- **Y-axis**: B_m,θ (-0.2 to 0.6)
### Legend
- **Location**: Right side of the chart
- **Entries**:
- Blue line: base:1e4
- Green line: base:1e5
- Orange line: base:1e6
### Data Series Trends
1. **Blue (base:1e4)**:
- Starts at ~0.6, declines to ~0.1 by x=10,000.
- Oscillations persist but decay in amplitude.
- Final value at x=30,000: ~0.02.
2. **Green (base:1e5)**:
- Begins at ~0.5, declines to ~0.05 by x=10,000.
- Oscillations are smaller than blue but larger than orange.
- Final value at x=30,000: ~0.03.
3. **Orange (base:1e6)**:
- Starts at ~0.4, declines to ~0.02 by x=10,000.
- Oscillations are smallest in amplitude.
- Final value at x=30,000: ~0.01.
### Spatial Grounding
- Legend colors match line colors exactly:
- Blue (1e4) aligns with the highest initial value.
- Green (1e5) aligns with intermediate initial value.
- Orange (1e6) aligns with the lowest initial value.
---
## Key Observations
1. **Base Value Impact**:
- Higher base values (e.g., 1e6) correlate with lower initial B_m,θ and slower decay.
- Lower base values (e.g., 1e2) show steeper initial declines but smaller oscillations.
2. **Oscillation Behavior**:
- All lines exhibit damped oscillations, with higher base values showing less pronounced oscillations.
3. **Consistency Across Charts**:
- The trend of decaying oscillations is consistent, but the right chart (larger x-range) shows more sustained oscillations.
---
## Notes
- No non-English text detected.
- No data tables or embedded diagrams present.
- All textual information extracted from axis labels, legends, and visual trends.