\n
## Image Analysis: Urban Environment Visualizations
### Overview
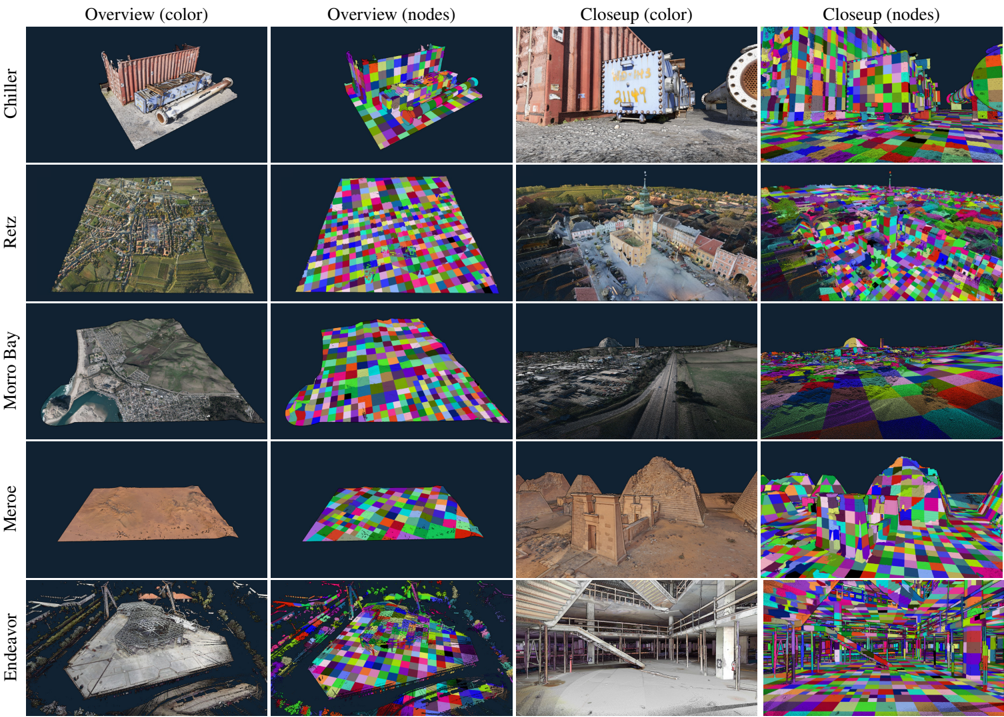
The image presents a comparative visualization of five different urban environments – Chiller, Retz, Morro Bay, Meroe, and Endeavor. Each environment is depicted in four views: an overview showing colorized representation, an overview showing a node-based representation, a closeup showing colorized representation, and a closeup showing a node-based representation. The visualizations appear to be derived from 3D scans or models of these locations.
### Components/Axes
The image is organized as a 5x4 grid.
* **Rows:** Represent the different urban environments (Chiller, Retz, Morro Bay, Meroe, Endeavor).
* **Columns:** Represent the different visualization types:
* Overview (color)
* Overview (nodes)
* Closeup (color)
* Closeup (nodes)
There are no explicit axes or scales present. The "color" views appear to be a rendering of the 3D model with color applied, while the "nodes" views represent the environment as a grid of colored squares, potentially representing data points or features.
### Detailed Analysis or Content Details
**Chiller:**
* Overview (color): Shows a building interior, possibly a warehouse or industrial space, with a white structure and dark flooring.
* Overview (nodes): A grid of colored squares (red, yellow, green, blue, purple) covering a rectangular area.
* Closeup (color): A shipping container with graffiti on it. The graffiti includes yellow and blue paint.
* Closeup (nodes): A grid of colored squares (red, yellow, green, blue, purple) covering a smaller rectangular area.
**Retz:**
* Overview (color): Shows a dense urban area with buildings and streets.
* Overview (nodes): A grid of colored squares (red, yellow, green, blue, purple) covering a rectangular area.
* Closeup (color): A building facade with a dark-colored wall and a door.
* Closeup (nodes): A grid of colored squares (red, yellow, green, blue, purple) covering a smaller rectangular area.
**Morro Bay:**
* Overview (color): Shows a coastal landscape with a large rock formation (Morro Rock) and a shoreline.
* Overview (nodes): A grid of colored squares (red, yellow, green, blue, purple) covering a rectangular area.
* Closeup (color): A railway track with a building in the background.
* Closeup (nodes): A grid of colored squares (red, yellow, green, blue, purple) covering a smaller rectangular area.
**Meroe:**
* Overview (color): Shows a desert landscape with pyramid-like structures.
* Overview (nodes): A grid of colored squares (red, yellow, green, blue, purple) covering a rectangular area.
* Closeup (color): A pyramid-like structure with a textured surface.
* Closeup (nodes): A grid of colored squares (red, yellow, green, blue, purple) covering a smaller rectangular area.
**Endeavor:**
* Overview (color): Shows a large, open interior space, possibly a factory or warehouse, with a complex roof structure.
* Overview (nodes): A grid of colored squares (red, yellow, green, blue, purple) covering a rectangular area.
* Closeup (color): An interior view of the same space, showing support beams and a concrete floor.
* Closeup (nodes): A grid of colored squares (red, yellow, green, blue, purple) covering a smaller rectangular area.
The node-based views consistently use the colors red, yellow, green, blue, and purple, distributed seemingly randomly across the grid. The density of nodes appears relatively uniform across all environments.
### Key Observations
* The "nodes" visualizations consistently use the same color palette across all environments.
* The "color" visualizations show a diverse range of environments, from indoor industrial spaces to outdoor urban and natural landscapes.
* The "closeup" views provide more detailed representations of specific features within each environment.
* There is no quantitative data presented; the image is purely visual.
### Interpretation
The image likely demonstrates a method for visualizing and analyzing urban environments using 3D scanning or modeling techniques. The "color" views provide a realistic representation of the environment, while the "nodes" views may represent a data layer overlaid on the environment, potentially indicating points of interest, sensor locations, or other relevant data. The consistent use of the same color palette in the "nodes" views suggests that the colors may represent different categories or values of data.
The purpose of this visualization could be for urban planning, environmental monitoring, or security applications. The node-based representation could be used to identify patterns, anomalies, or areas of concern within the environment. The comparison of different environments allows for a visual assessment of their characteristics and potential challenges.
The image does not provide enough information to determine the specific meaning of the colors or the data represented by the nodes. Further context would be needed to fully understand the purpose and implications of these visualizations. The image is a demonstration of a visualization technique, rather than a presentation of specific data findings.