## Factuality Evaluation Diagram: Response Sampling, Self-Evaluation, and Fine-tuning
### Overview
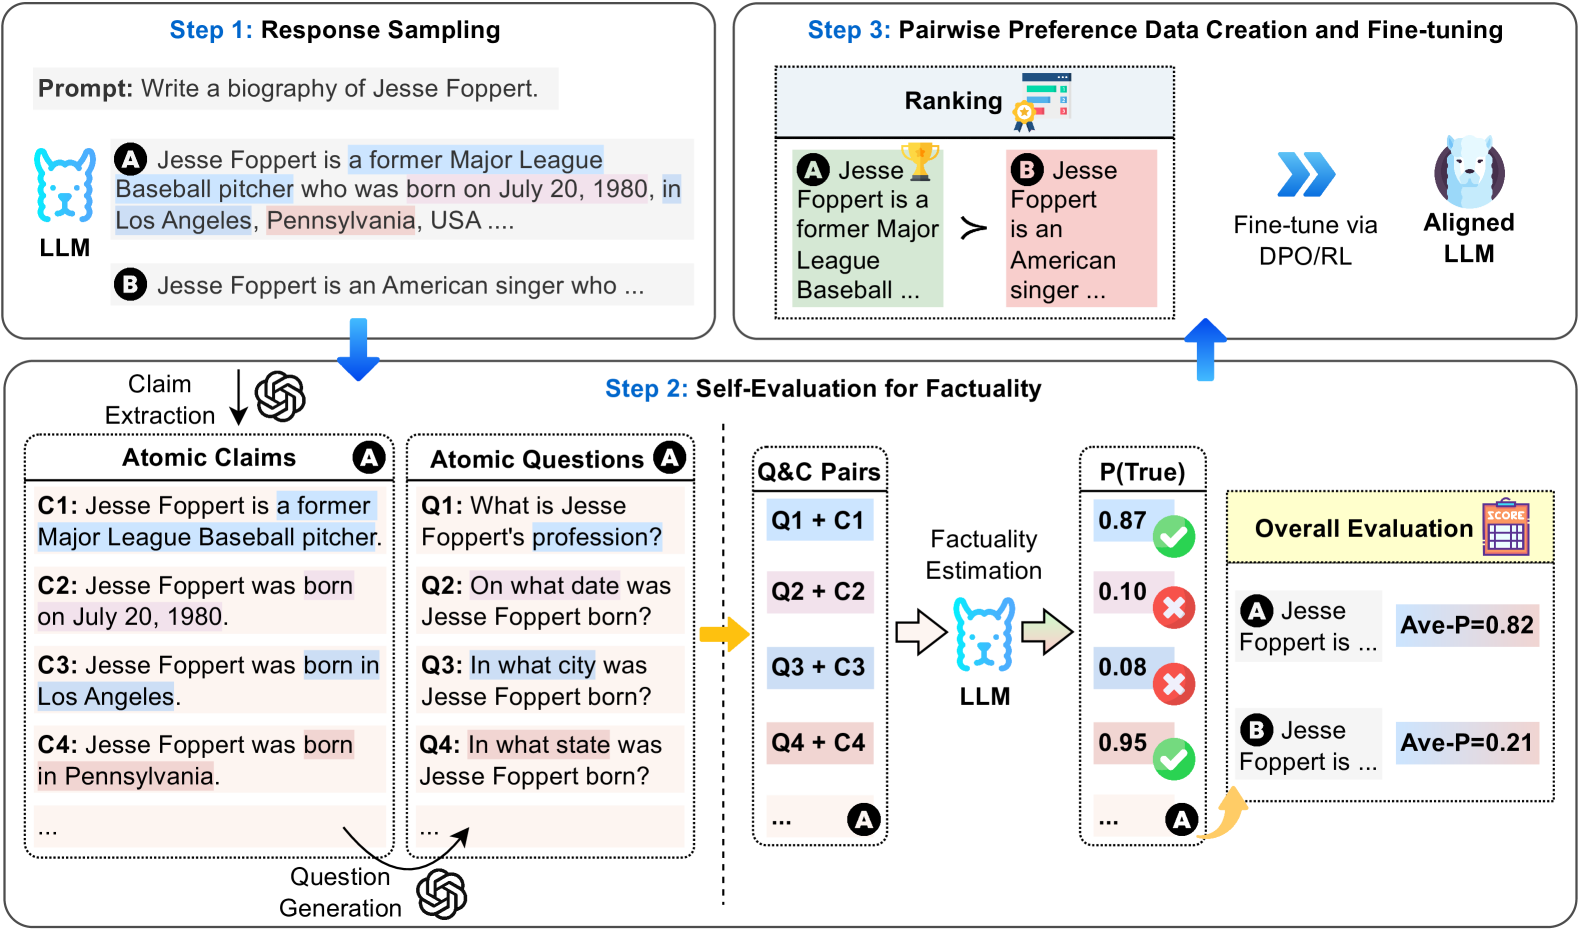
The image presents a diagram illustrating a three-step process for evaluating and fine-tuning a Language Learning Model (LLM) based on factuality. The process involves response sampling, self-evaluation for factuality, and pairwise preference data creation for fine-tuning.
### Components/Axes
* **Step 1: Response Sampling**
* **Prompt:** "Write a biography of Jesse Foppert."
* **LLM:** Represents the Language Learning Model.
* **Response A:** "Jesse Foppert is a former Major League Baseball pitcher who was born on July 20, 1980, in Los Angeles, Pennsylvania, USA..."
* "former Major League Baseball pitcher" is highlighted in blue.
* "born on July 20, 1980" is highlighted in pink.
* "Los Angeles" is highlighted in blue.
* "Pennsylvania" is highlighted in pink.
* **Response B:** "Jesse Foppert is an American singer who..."
* **Step 2: Self-Evaluation for Factuality**
* **Claim Extraction:** An arrow points down from the LLM output to "Claim Extraction" with a recycle symbol.
* **Atomic Claims (A):**
* **C1:** "Jesse Foppert is a former Major League Baseball pitcher." (Highlighted in blue)
* **C2:** "Jesse Foppert was born on July 20, 1980." (Highlighted in pink)
* **C3:** "Jesse Foppert was born in Los Angeles." (Highlighted in blue)
* **C4:** "Jesse Foppert was born in Pennsylvania." (Highlighted in pink)
* "..." indicates more claims.
* **Question Generation:** An arrow points from "Atomic Claims" to "Question Generation" with a recycle symbol.
* **Atomic Questions (A):**
* **Q1:** "What is Jesse Foppert's profession?" (Highlighted in blue)
* **Q2:** "On what date was Jesse Foppert born?" (Highlighted in pink)
* **Q3:** "In what city was Jesse Foppert born?" (Highlighted in blue)
* **Q4:** "In what state was Jesse Foppert born?" (Highlighted in pink)
* "..." indicates more questions.
* **Q&C Pairs:**
* Q1 + C1
* Q2 + C2
* Q3 + C3
* Q4 + C4
* "..." indicates more pairs.
* **Factuality Estimation:** An arrow points from "Q&C Pairs" to "Factuality Estimation" performed by the LLM.
* **P(True):** Probability of the claim being true.
* 0.87 (with a green checkmark)
* 0.10 (with a red "X")
* 0.08 (with a red "X")
* 0.95 (with a green checkmark)
* "..." indicates more probabilities.
* **Overall Evaluation:**
* **A Jesse Foppert is ... Ave-P=0.82**
* **B Jesse Foppert is ... Ave-P=0.21**
* **Step 3: Pairwise Preference Data Creation and Fine-tuning**
* **Ranking:**
* **A Jesse Foppert is a former Major League Baseball ...** (with a trophy icon)
* ">" symbol indicating preference.
* **B Jesse Foppert is an American singer ...**
* **Fine-tune via DPO/RL:** An arrow points from the ranking to "Fine-tune via DPO/RL".
* **Aligned LLM:** Represents the fine-tuned LLM.
### Detailed Analysis or Content Details
The diagram outlines a process for improving the factuality of LLM-generated text.
1. **Response Sampling:** The LLM generates two responses (A and B) to the prompt. Response A contains factual claims about Jesse Foppert's profession and birth details, while Response B makes a different claim.
2. **Self-Evaluation for Factuality:**
* Claims are extracted from the responses and converted into atomic claims (C1-C4).
* Questions are generated based on these claims (Q1-Q4).
* Question-Claim pairs are created (Q1+C1, Q2+C2, etc.).
* The LLM estimates the probability of each claim being true (P(True)).
* An overall evaluation is performed, resulting in average precision scores (Ave-P) for each response. Response A has Ave-P=0.82, while Response B has Ave-P=0.21.
3. **Pairwise Preference Data Creation and Fine-tuning:**
* The responses are ranked based on their factuality scores. Response A is preferred over Response B.
* The LLM is fine-tuned using Direct Preference Optimization/Reinforcement Learning (DPO/RL) based on the pairwise preferences.
### Key Observations
* The process uses atomic claims and questions to break down the factuality evaluation into smaller, more manageable components.
* The LLM is used for both generating responses and evaluating their factuality.
* Pairwise preference data is used to fine-tune the LLM, improving its ability to generate factual text.
* The probabilities of the atomic claims being true are 0.87, 0.10, 0.08, and 0.95.
### Interpretation
The diagram illustrates a method for improving the factuality of LLMs by incorporating a self-evaluation step and using pairwise preference data for fine-tuning. The process leverages the LLM's ability to generate both responses and questions, allowing for an automated and iterative approach to factuality improvement. The higher average precision score for Response A (0.82) compared to Response B (0.21) indicates that the evaluation process effectively distinguishes between more and less factual responses. The fine-tuning step aims to align the LLM with factual information, leading to more reliable and trustworthy text generation.