TECHNICAL ASSET FINGERPRINT
59df531be9bb65c5e4520d8a
Click to view fullscreen
Press ESC or click to close
FOUND IN PAPERS
EXPERT: healer-alpha-free VERSION 1
RUNTIME: free/openrouter/healer-alpha
INTEL_VERIFIED
## Diagram: Three-Step Process for LLM Factuality Improvement via Self-Evaluation and Preference Tuning
### Overview
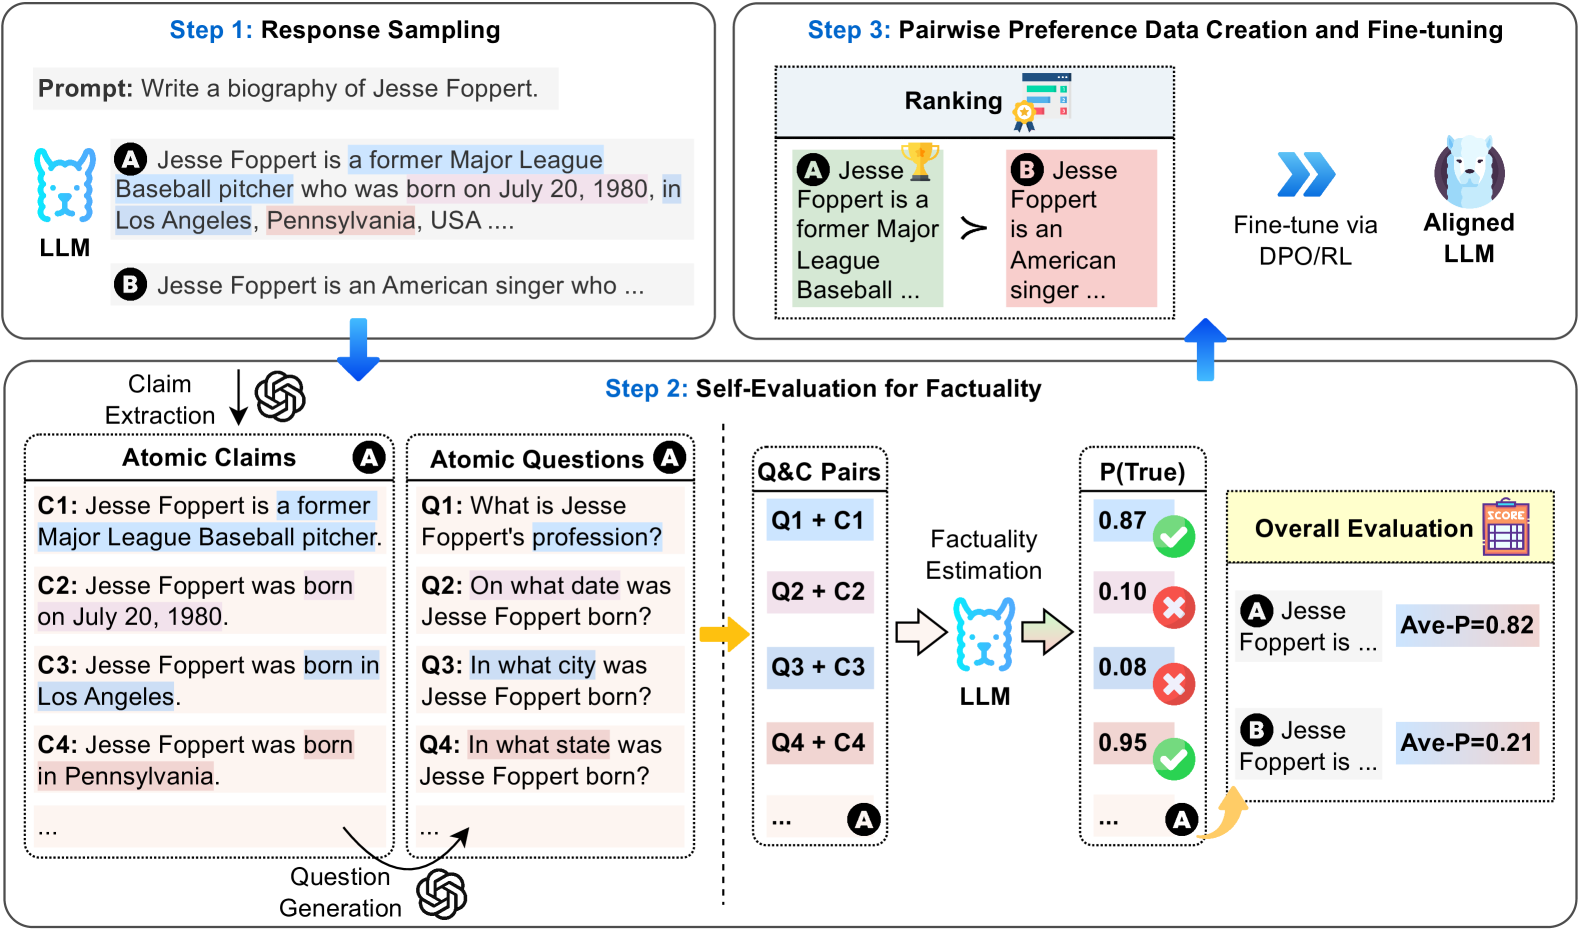
This diagram illustrates a three-step pipeline designed to improve the factual accuracy of Large Language Models (LLMs). The process uses a specific example—generating a biography of Jesse Foppert—to demonstrate how responses are sampled, evaluated for factuality through self-generated questions and claims, and then used to create preference data for fine-tuning an aligned LLM.
### Components/Axes
The diagram is divided into three main, sequentially connected boxes, labeled as steps. The flow is indicated by blue arrows.
**Step 1: Response Sampling**
* **Prompt:** "Write a biography of Jesse Foppert."
* **LLM Icon:** A blue, stylized dog/llama head labeled "LLM".
* **Generated Responses:** Two sample responses are shown:
* **Response A (Highlighted in light blue):** "Jesse Foppert is a former Major League Baseball pitcher who was born on July 20, 1980, in Los Angeles, Pennsylvania, USA ...."
* **Response B (Highlighted in light pink):** "Jesse Foppert is an American singer who ..."
**Step 2: Self-Evaluation for Factuality**
This is the largest and most complex section, detailing the core evaluation mechanism.
* **Claim Extraction:** An arrow from Response A points to a box labeled "Atomic Claims" with an OpenAI logo icon. It lists four extracted claims:
* **C1:** "Jesse Foppert is a former Major League Baseball pitcher." (Highlighted in light blue)
* **C2:** "Jesse Foppert was born on July 20, 1980." (Highlighted in light blue)
* **C3:** "Jesse Foppert was born in Los Angeles." (Highlighted in light blue)
* **C4:** "Jesse Foppert was born in Pennsylvania." (Highlighted in light pink)
* **Ellipsis (...)** indicates more claims.
* **Question Generation:** An arrow from the "Atomic Claims" box points to a box labeled "Atomic Questions" with an OpenAI logo icon. It lists corresponding questions:
* **Q1:** "What is Jesse Foppert's profession?"
* **Q2:** "On what date was Jesse Foppert born?"
* **Q3:** "In what city was Jesse Foppert born?"
* **Q4:** "In what state was Jesse Foppert born?"
* **Ellipsis (...)** indicates more questions.
* **Q&C Pairs:** A dashed box shows the pairing of questions and claims (e.g., "Q1 + C1", "Q2 + C2").
* **Factuality Estimation:** An arrow points from the Q&C Pairs to another LLM icon (blue dog/llama head). The LLM outputs a probability score, **P(True)**, for each claim.
* **P(True) Scores:**
* For Q1+C1: **0.87** (Green checkmark icon)
* For Q2+C2: **0.10** (Red X icon)
* For Q3+C3: **0.08** (Red X icon)
* For Q4+C4: **0.95** (Green checkmark icon)
* **Ellipsis (...)** indicates more scores.
* **Overall Evaluation:** A yellow box labeled "Overall Evaluation" with a scorecard icon aggregates the results.
* **For Response A:** "Jesse Foppert is ..." with **Ave-P=0.82** (Average Probability).
* **For Response B:** "Jesse Foppert is ..." with **Ave-P=0.21**.
**Step 3: Pairwise Preference Data Creation and Fine-tuning**
* **Ranking:** A box shows the two responses ranked based on their factuality scores.
* **Response A** (with a gold trophy icon) is shown as greater than (**>**) **Response B**.
* Text: "Jesse Foppert is a former Major League Baseball ..." (A) vs. "Jesse Foppert is an American singer ..." (B).
* **Fine-tuning Process:** A blue double-arrow points from the ranking to an icon of an "Aligned LLM" (a blue dog/llama head inside a purple circle). The text specifies: "Fine-tune via DPO/RL" (Direct Preference Optimization / Reinforcement Learning).
### Detailed Analysis
The diagram meticulously traces the factuality evaluation of a single response (Response A).
1. **Claim & Question Generation:** The system breaks down the biography into atomic, verifiable claims (C1-C4) and generates corresponding factual questions (Q1-Q4).
2. **Factuality Scoring:** The LLM itself estimates the probability that each claim is true when paired with its question. The scores reveal inconsistencies:
* The profession (pitcher) and birth state (Pennsylvania) are rated highly probable (0.87, 0.95).
* The birth date (July 20, 1980) and city (Los Angeles) are rated very low probability (0.10, 0.08). This suggests the model is uncertain or knows these specific details are likely incorrect.
3. **Aggregation:** The average probability (**Ave-P**) serves as a factuality score for the entire response. Response A scores 0.82, while the alternative Response B scores only 0.21.
4. **Preference Creation:** The higher-scoring response (A) is preferred over the lower-scoring one (B), creating a pairwise preference data point.
5. **Alignment:** This preference data is then used to fine-tune the LLM using techniques like DPO or RL, resulting in an "Aligned LLM" expected to generate more factual responses.
### Key Observations
* **Self-Reflection Mechanism:** The core innovation is using the LLM to evaluate its own outputs by decomposing them into atomic facts and generating verification questions.
* **Granular Error Identification:** The system doesn't just give a pass/fail; it pinpoints which specific pieces of information (birth date, city) are likely false within an otherwise plausible-sounding biography.
* **Color-Coding:** Light blue highlights are used for claims/responses being analyzed (Response A, its claims). Light pink highlights are used for the alternative response (Response B) and for the specific claim (C4) that is factually incorrect (Pennsylvania vs. the correct state, which is likely California).
* **Spatial Flow:** The process flows logically from top-left (Step 1) down to the detailed evaluation (Step 2), then up to the final ranking and tuning (Step 3).
### Interpretation
This diagram presents a method for **self-improving LLM factuality without external supervision**. The key insight is that an LLM's uncertainty, measured via its own probability estimates for self-generated verification questions, can be a reliable signal for factual errors.
* **What it demonstrates:** It shows a closed-loop system where an LLM's weaknesses (generating plausible but incorrect facts) are used to create the training signal (preference data) to fix those very weaknesses. The example of Jesse Foppert—a real former MLB pitcher born in California, not Pennsylvania—effectively illustrates how a model might mix correct and incorrect details.
* **How elements relate:** Step 1 provides the raw material. Step 2 is the diagnostic engine, converting text into quantifiable factuality metrics. Step 3 is the corrective action, using the diagnostics to guide model improvement.
* **Significance:** This approach addresses a major challenge in AI alignment: scaling the evaluation and correction of factual knowledge. By automating the creation of preference data through self-evaluation, it potentially allows for continuous, scalable improvement of LLMs on factual accuracy, reducing reliance on human annotators for every piece of information. The low probability scores for the birth date and city (0.10, 0.08) are particularly notable, as they show the model has some internal knowledge that these claims are dubious, even if it generated them initially.
DECODING INTELLIGENCE...