## Flowchart: LLM Response Evaluation and Fine-tuning Process
### Overview
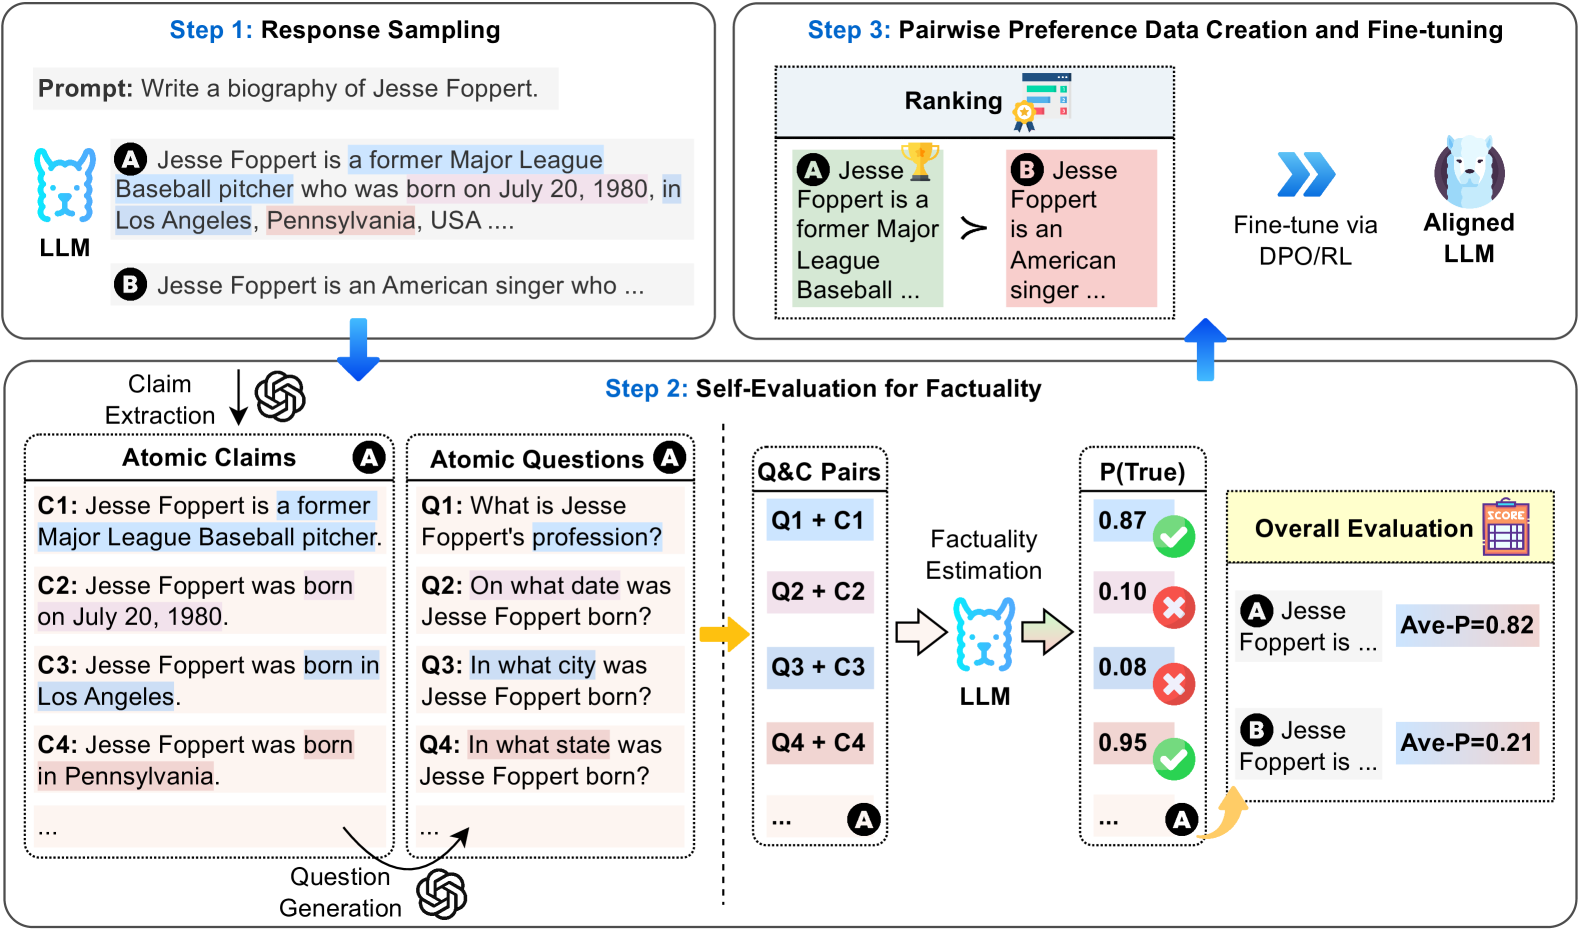
The diagram illustrates a three-step process for evaluating and refining large language model (LLM) responses. It combines response generation, factuality assessment, and preference-based fine-tuning using atomic claims, question-answer pairs, and pairwise ranking.
### Components/Axes
1. **Step 1: Response Sampling**
- Prompt: "Write a biography of Jesse Foppert."
- Example Responses:
- **A** (Blue-highlighted): "Jesse Foppert is a former Major League Baseball pitcher who was born on July 20, 1980, in Los Angeles, Pennsylvania, USA..."
- **B** (Pink-highlighted): "Jesse Foppert is an American singer who..."
- Claim Extraction → Atomic Claims (C1-C4) and Atomic Questions (Q1-Q4)
2. **Step 2: Self-Evaluation for Factuality**
- **Q&C Pairs**: Questions (Q1-Q4) combined with Atomic Claims (C1-C4)
- **Factually Estimation**:
- **P(True)** values:
- Q1+C1: 0.87 (✓)
- Q2+C2: 0.10 (✗)
- Q3+C3: 0.08 (✗)
- Q4+C4: 0.95 (✓)
- **Overall Evaluation**:
- Response A: Ave-P=0.82
- Response B: Ave-P=0.21
3. **Step 3: Pairwise Preference Data Creation and Fine-tuning**
- Ranking system with trophy (✓) and medal (✗) symbols
- Fine-tuning via DPO/RL using aligned LLM
### Detailed Analysis
- **Atomic Claims**:
- C1: "Jesse Foppert is a former Major League Baseball pitcher."
- C2: "Jesse Foppert was born on July 20, 1980."
- C3: "Jesse Foppert was born in Los Angeles."
- C4: "Jesse Foppert was born in Pennsylvania."
- **Atomic Questions**:
- Q1: "What is Jesse Foppert's profession?"
- Q2: "On what date was Jesse Foppert born?"
- Q3: "In what city was Jesse Foppert born?"
- Q4: "In what state was Jesse Foppert born?"
- **Q&C Pair Accuracy**:
- Q1+C1: 87% confidence (correct)
- Q2+C2: 10% confidence (incorrect)
- Q3+C3: 8% confidence (incorrect)
- Q4+C4: 95% confidence (correct)
- **Color Coding**:
- Blue: Correct answers (✓)
- Pink: Incorrect answers (✗)
- Green: High factual confidence
- Red: Low factual confidence
### Key Observations
1. **Factuality Discrepancies**:
- Response A contains conflicting birth locations (Los Angeles vs. Pennsylvania)
- Q3+C3 and Q4+C4 show contradictory claims with low/high confidence
2. **Model Performance**:
- Response A achieves 82% average factual confidence
- Response B scores significantly lower at 21%
3. **Fine-tuning Focus**:
- DPO/RL targets response A's factual weaknesses (Q2+C2, Q3+C3)
### Interpretation
This diagram demonstrates a systematic approach to improving LLM outputs through:
1. **Atomic Fact Decomposition**: Breaking claims into verifiable units
2. **Self-Critique Mechanism**: Using Q&C pairs to identify factual gaps
3. **Preference Learning**: Ranking responses to guide model refinement
The process reveals that while response A contains more factual content (87% and 95% confidence claims), its contradictions (Los Angeles vs. Pennsylvania) create evaluation challenges. The fine-tuning step likely focuses on resolving these inconsistencies through preference optimization, prioritizing responses that maintain high factual confidence across all claims while eliminating contradictions.