## Line Graph: Loss vs. Position from Start
### Overview
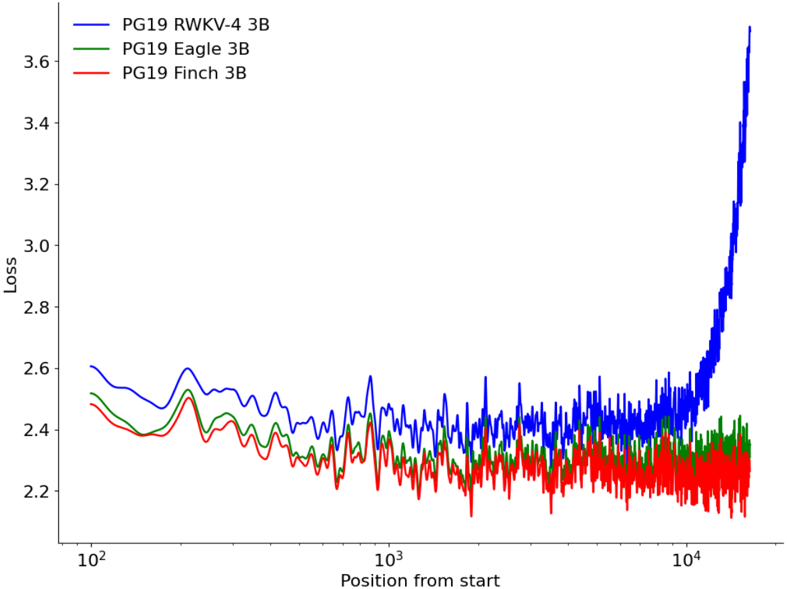
The image is a line graph comparing the loss values of three models (PG19 RWKV-4 3B, PG19 Eagle 3B, and PG19 Finch 3B) across positions from start, measured on a logarithmic scale (10² to 10⁴). The y-axis represents "Loss" (2.2–3.6), while the x-axis represents "Position from start" (logarithmic scale). The graph highlights distinct trends in loss behavior for each model.
### Components/Axes
- **X-axis (Position from start)**: Logarithmic scale with markers at 10², 10³, and 10⁴.
- **Y-axis (Loss)**: Linear scale ranging from 2.2 to 3.6.
- **Legend**: Located in the top-left corner, associating colors with models:
- **Blue**: PG19 RWKV-4 3B
- **Green**: PG19 Eagle 3B
- **Red**: PG19 Finch 3B
### Detailed Analysis
1. **PG19 RWKV-4 3B (Blue Line)**:
- Starts at ~2.6 (10² position), dips to ~2.4 (10³ position), then **spikes sharply** to ~3.6 at 10⁴.
- Shows significant volatility, with sharp increases and decreases, particularly after 10³.
2. **PG19 Eagle 3B (Green Line)**:
- Remains relatively stable, fluctuating between ~2.4 and 2.5 across all positions.
- No sharp spikes or drops; maintains a consistent trend.
3. **PG19 Finch 3B (Red Line)**:
- Similar to the green line, with minor fluctuations between ~2.3 and 2.5.
- Slightly more variability than the green line but no extreme spikes.
### Key Observations
- The **blue line (PG19 RWKV-4 3B)** exhibits a **dramatic increase in loss** at the 10⁴ position, reaching ~3.6, far exceeding the other models.
- The **green (Eagle)** and **red (Finch)** lines show **stable loss values** (~2.4–2.5) throughout, with no significant deviations.
- The logarithmic x-axis emphasizes the scale of positions, with the spike in the blue line occurring at the far-right end of the graph.
### Interpretation
The data suggests that the **PG19 RWKV-4 3B model experiences a critical failure or anomaly** at the 10⁴ position, as indicated by the sharp loss spike. This could imply:
- **Poor generalization** at longer sequence lengths (10⁴ positions).
- **Computational instability** or resource exhaustion in the RWKV-4 model under high positional demands.
- The **Eagle and Finch models** demonstrate **robustness** in maintaining low loss across all positions, indicating better stability or optimization for the task.
The logarithmic x-axis underscores the **exponential growth in positional complexity**, with the RWKV-4 model’s performance degrading disproportionately at higher scales. This highlights potential limitations in the RWKV-4 architecture for handling extended sequences compared to the Eagle and Finch models.