## Bar Chart: Surrogate Model Performance
### Overview
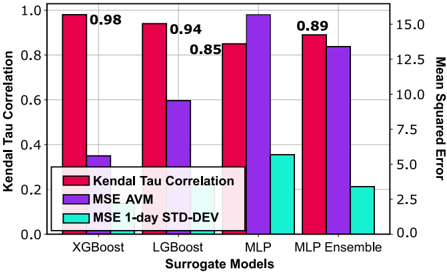
The image is a bar chart comparing the performance of different surrogate models (XGBoost, LGBoost, MLP, and MLP Ensemble) based on Kendal Tau Correlation, MSE AVM (Mean Squared Error Average Variance Method), and MSE 1-day STD-DEV (Mean Squared Error 1-day Standard Deviation). The chart uses two y-axes: one for Kendal Tau Correlation (left) and another for Mean Squared Error (right).
### Components/Axes
* **X-axis:** Surrogate Models (XGBoost, LGBoost, MLP, MLP Ensemble)
* **Left Y-axis:** Kendal Tau Correlation, ranging from 0.0 to 1.0
* **Right Y-axis:** Mean Squared Error, ranging from 0.0 to 15.0
* **Legend:** Located in the center of the chart.
* Red: Kendal Tau Correlation
* Purple: MSE AVM
* Teal: MSE 1-day STD-DEV
### Detailed Analysis
Here's a breakdown of the data for each model:
* **XGBoost:**
* Kendal Tau Correlation: 0.98 (Red bar)
* MSE AVM: Approximately 0.35 (Purple bar)
* MSE 1-day STD-DEV: Approximately 0.05 (Teal bar)
* **LGBoost:**
* Kendal Tau Correlation: 0.94 (Red bar)
* MSE AVM: Approximately 6.0 (Purple bar)
* MSE 1-day STD-DEV: Approximately 0.1 (Teal bar)
* **MLP:**
* Kendal Tau Correlation: 0.85 (Red bar)
* MSE AVM: Approximately 14.0 (Purple bar)
* MSE 1-day STD-DEV: Approximately 5.5 (Teal bar)
* **MLP Ensemble:**
* Kendal Tau Correlation: 0.89 (Red bar)
* MSE AVM: Approximately 13.0 (Purple bar)
* MSE 1-day STD-DEV: Approximately 2.2 (Teal bar)
### Key Observations
* XGBoost has the highest Kendal Tau Correlation (0.98) and the lowest MSE AVM and MSE 1-day STD-DEV.
* MLP and MLP Ensemble have significantly higher MSE AVM values compared to XGBoost and LGBoost.
* LGBoost has a relatively high Kendal Tau Correlation (0.94) but also a higher MSE AVM than XGBoost.
* MSE 1-day STD-DEV is generally low for XGBoost and LGBoost, but higher for MLP and MLP Ensemble.
### Interpretation
The chart suggests that XGBoost performs the best among the tested surrogate models, exhibiting the highest correlation and the lowest error rates. LGBoost also shows good correlation but has a higher MSE AVM compared to XGBoost. MLP and MLP Ensemble models have lower correlation and significantly higher MSE AVM, indicating potentially less accurate or stable performance. The MSE 1-day STD-DEV provides insight into the variability of the error, with XGBoost and LGBoost showing more consistent performance compared to MLP and MLP Ensemble. The ensemble method does not appear to improve the performance of the MLP model significantly.