## Grouped Bar Chart: Performance Metrics of Surrogate Models
### Overview
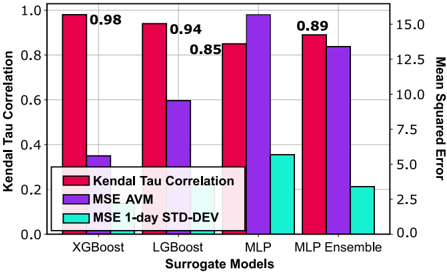
This image is a grouped bar chart comparing the performance of four different "Surrogate Models" (XGBoost, LGBoost, MLP, and MLP Ensemble). The chart evaluates these models across three distinct metrics: "Kendal Tau Correlation," "MSE AVM," and "MSE 1-day STD-DEV." The chart uses a dual-axis layout, though the right-hand axis appears to be unlabelled and potentially unused by the plotted data.
### Components/Axes
* **X-Axis:** Labeled "Surrogate Models." It contains four categories: XGBoost, LGBoost, MLP, and MLP Ensemble.
* **Left Y-Axis:** Labeled "Kendal Tau Correlation." The scale ranges from 0.0 to 1.0 in increments of 0.2.
* **Right Y-Axis:** Unlabeled. The scale ranges from 0.0 to 15.0 in increments of 2.5.
* **Legend:** Located in the bottom-left quadrant of the chart area.
* **Red Bar:** Kendal Tau Correlation
* **Purple Bar:** MSE AVM
* **Cyan/Teal Bar:** MSE 1-day STD-DEV
* **Annotations:** Specific numerical values are provided for the Red bars (Kendal Tau Correlation) above each corresponding bar.
### Detailed Analysis
The data is grouped by model. Below are the approximate values for each metric based on the visual representation against the left-hand axis (0.0–1.0):
| Model | Metric | Color | Approximate Value |
| :--- | :--- | :--- | :--- |
| **XGBoost** | Kendal Tau Correlation | Red | 0.98 (Explicitly labeled) |
| | MSE AVM | Purple | ~0.35 |
| | MSE 1-day STD-DEV | Cyan | ~0.35 |
| **LGBoost** | Kendal Tau Correlation | Red | 0.94 (Explicitly labeled) |
| | MSE AVM | Purple | ~0.60 |
| | MSE 1-day STD-DEV | Cyan | ~0.30 |
| **MLP** | Kendal Tau Correlation | Red | 0.85 (Explicitly labeled) |
| | MSE AVM | Purple | ~0.98 |
| | MSE 1-day STD-DEV | Cyan | ~0.35 |
| **MLP Ensemble** | Kendal Tau Correlation | Red | 0.89 (Explicitly labeled) |
| | MSE AVM | Purple | ~0.85 |
| | MSE 1-day STD-DEV | Cyan | ~0.20 |
### Key Observations
* **Highest Correlation:** XGBoost demonstrates the highest Kendal Tau Correlation at 0.98.
* **Lowest Correlation:** The MLP model shows the lowest Kendal Tau Correlation at 0.85.
* **MSE AVM Trend:** The "MSE AVM" (Purple) metric shows an upward trend from XGBoost to MLP, peaking at MLP (~0.98), before slightly decreasing for the MLP Ensemble.
* **MSE 1-day STD-DEV Trend:** This metric (Cyan) remains relatively low and stable across all models, with the MLP Ensemble achieving the lowest value (~0.20).
* **Axis Discrepancy:** There is a significant visual disconnect between the data and the right-hand axis. While the right axis scales up to 15.0, all data points are plotted against the left axis (0.0–1.0). This suggests the right axis may be extraneous or intended for a different dataset not present in this visualization.
### Interpretation
The data suggests that for the specific task being modeled, tree-based models (XGBoost and LGBoost) provide a higher Kendal Tau Correlation (indicating better rank-order agreement) compared to the neural network-based models (MLP and MLP Ensemble).
However, the "MSE AVM" (Mean Squared Error AVM) metric behaves inversely to the correlation for the MLP models; as the correlation drops for the MLP, the MSE AVM increases significantly compared to the tree-based models. The MLP Ensemble appears to be an attempt to stabilize the MLP model, as it improves the correlation (0.89 vs 0.85) and reduces the MSE 1-day STD-DEV compared to the standard MLP. The presence of the unused 0–15 axis on the right is a notable anomaly, suggesting either a formatting error in the chart generation or that the MSE metrics were originally intended to be plotted on a different scale.