## Grouped Bar Chart: Surrogate Model Performance Comparison
### Overview
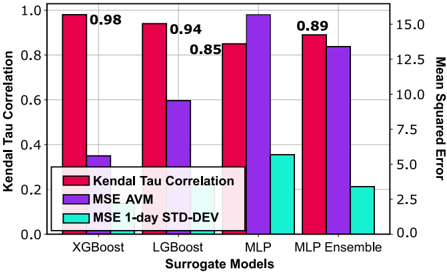
The image displays a grouped bar chart comparing the performance of four different surrogate machine learning models across three distinct metrics. The chart uses a dual y-axis system to accommodate different scales for the metrics.
### Components/Axes
* **Chart Type:** Grouped bar chart with dual y-axes.
* **X-Axis (Bottom):** Labeled "Surrogate Models". It lists four categorical models:
1. XGBoost
2. LightGBM (Note: The chart label reads "LGBost", which is likely a typo for "LightGBM" or "LGBM")
3. MLP (Multi-Layer Perceptron)
4. MLP Ensemble
* **Primary Y-Axis (Left):** Labeled "Kendal Tau Correlation". Scale ranges from 0.0 to 1.0 in increments of 0.2.
* **Secondary Y-Axis (Right):** Labeled "Mean Squared Error". Scale ranges from 0.0 to 15.0 in increments of 2.5.
* **Legend:** Located in the bottom-left corner of the plot area. It defines three data series:
* **Red Bar:** "Kendal Tau Correlation" (Plotted against the left y-axis).
* **Purple Bar:** "MSE AVM" (Plotted against the right y-axis).
* **Cyan/Teal Bar:** "MSE 1-day STD-DEV" (Plotted against the right y-axis).
### Detailed Analysis
**Data Series & Values (Approximate, with labeled values noted):**
1. **XGBoost:**
* **Kendal Tau Correlation (Red):** **0.98** (Value explicitly labeled on top of the bar). This is the highest correlation value on the chart.
* **MSE AVM (Purple):** ~0.35 (Estimated from right y-axis).
* **MSE 1-day STD-DEV (Cyan):** ~0.25 (Estimated from right y-axis). This is the lowest error variability shown.
2. **LightGBM:**
* **Kendal Tau Correlation (Red):** **0.94** (Value explicitly labeled on top of the bar).
* **MSE AVM (Purple):** ~0.90 (Estimated from right y-axis).
* **MSE 1-day STD-DEV (Cyan):** ~0.30 (Estimated from right y-axis).
3. **MLP:**
* **Kendal Tau Correlation (Red):** **0.85** (Value explicitly labeled on top of the bar).
* **MSE AVM (Purple):** ~14.8 (Estimated from right y-axis). This is the highest error value on the chart by a significant margin.
* **MSE 1-day STD-DEV (Cyan):** ~5.5 (Estimated from right y-axis).
4. **MLP Ensemble:**
* **Kendal Tau Correlation (Red):** **0.89** (Value explicitly labeled on top of the bar).
* **MSE AVM (Purple):** ~12.8 (Estimated from right y-axis).
* **MSE 1-day STD-DEV (Cyan):** ~3.2 (Estimated from right y-axis).
**Trend Verification:**
* **Kendal Tau Correlation (Red Bars):** The trend slopes downward from left to right, starting at the highest point (XGBoost: 0.98) and ending at a moderately high point (MLP Ensemble: 0.89). The single MLP model shows the lowest correlation.
* **MSE AVM (Purple Bars):** The trend shows a dramatic spike for the MLP model. It is relatively low for XGBoost and LightGBM, peaks sharply at MLP, and then decreases for the MLP Ensemble but remains much higher than the first two models.
* **MSE 1-day STD-DEV (Cyan Bars):** The trend generally increases from XGBoost to MLP, then decreases for the MLP Ensemble. The MLP model shows the highest variability in error.
### Key Observations
1. **Inverse Relationship:** There is a clear inverse relationship between the Kendall Tau Correlation and the MSE AVM for the MLP model. It has the lowest correlation and by far the highest mean squared error.
2. **Ensemble Effect:** The "MLP Ensemble" shows an improvement in correlation (0.89 vs 0.85) and a reduction in both error metrics compared to the single "MLP" model, demonstrating the benefit of ensembling for this architecture.
3. **Performance Leader:** XGBoost is the top performer across all metrics shown: it has the highest correlation (0.98), the lowest MSE AVM (~0.35), and the lowest error standard deviation (~0.25).
4. **Scale Disparity:** The MSE values for the MLP-based models are an order of magnitude larger than those for the tree-based models (XGBoost, LightGBM), indicating a fundamental difference in their predictive error on this task.
### Interpretation
This chart evaluates how well different surrogate models (simplified models used to approximate a complex "black-box" model) perform. The **Kendal Tau Correlation** measures how well the surrogate's ranking of predictions matches the original model's ranking (higher is better). The **MSE** metrics measure the average magnitude of prediction errors (lower is better).
The data suggests that for this specific task, **tree-based models (XGBoost, LightGBM) are significantly more effective surrogates** than neural network-based models (MLP). They achieve near-perfect rank correlation with the original model and have very low, stable prediction errors.
The poor performance of the single MLP, characterized by high error and low correlation, suggests it may be overfitting or is fundamentally ill-suited to capture the decision logic of the original model. The ensemble mitigates this but does not close the performance gap with the tree-based models. The "MSE 1-day STD-DEV" metric further indicates that the MLP's errors are not only large but also highly variable, making its predictions less reliable. The primary takeaway is the clear superiority of XGBoost as a surrogate in this context.