# Technical Diagram Analysis
## Diagram Overview
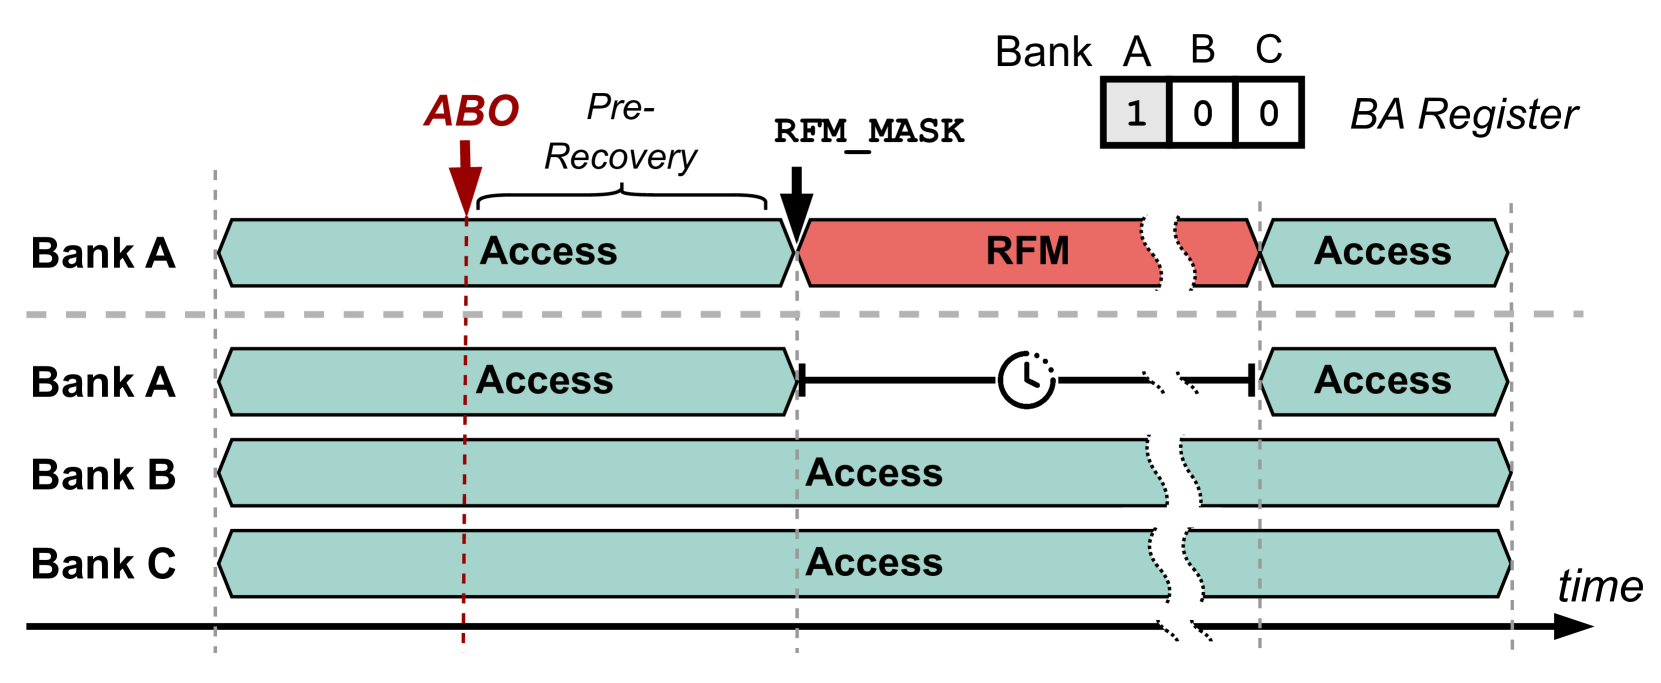
The image depicts a memory access timing diagram with three memory banks (A, B, C) and a Bank Address (BA) register. The diagram illustrates access patterns over time with specific annotations for memory operations.
## Key Components
1. **Memory Banks**
- **Bank A**: Contains two access periods with a red "RFM" (Read/Modify/Write) operation between them
- **Bank B**: Single continuous access period
- **Bank C**: Single continuous access period
2. **BA Register**
- Binary representation: `100`
- Legend indicates Bank A is active during this time period
3. **Annotations**
- **ABO Arrow**: Points to "Pre-Recovery" phase in Bank A's access sequence
- **RFM Mask**: Highlights the red "RFM" operation in Bank A
## Temporal Analysis
- **X-axis**: Time progression (left to right)
- **Y-axis**: Memory banks (A, B, C)
- **Time Segments**:
- Pre-Recovery phase (annotated by ABO arrow)
- RFM operation (red section in Bank A)
- Subsequent access periods in all banks
## Color Coding
- **Green**: Standard memory access periods
- **Red**: RFM (Read/Modify/Write) operation
- **Gray**: Binary representation in BA Register
## Spatial Grounding
- **Legend Position**: Top-right corner
- **BA Register**: Binary `100` corresponds to active Bank A
- **RFM Mask**: Red section in Bank A's timeline
## Trend Verification
1. **Bank A**:
- Pattern: Access → RFM → Access
- RFM operation occurs between two access periods
2. **Bank B**:
- Continuous access throughout the timeline
3. **Bank C**:
- Continuous access throughout the timeline
## Data Table Reconstruction
| Bank | Binary State | Access Pattern |
|------|--------------|-------------------------|
| A | 1 | Access → RFM → Access |
| B | 0 | Continuous Access |
| C | 0 | Continuous Access |
## Component Isolation
1. **Header**: BA Register binary representation (`100`)
2. **Main Chart**: Memory bank access timelines with RFM annotation
3. **Footer**: Time axis progression
## Critical Observations
1. The BA Register's `100` binary state directly correlates with Bank A's active status during the RFM operation
2. The ABO arrow indicates a recovery phase occurring between Bank A's access periods
3. The RFM operation in Bank A creates a temporal gap in its access sequence compared to Banks B and C
## Language Declaration
All text in the diagram is in English. No non-English content detected.