\n
## Bar Chart: Overlap Ratio Distribution
### Overview
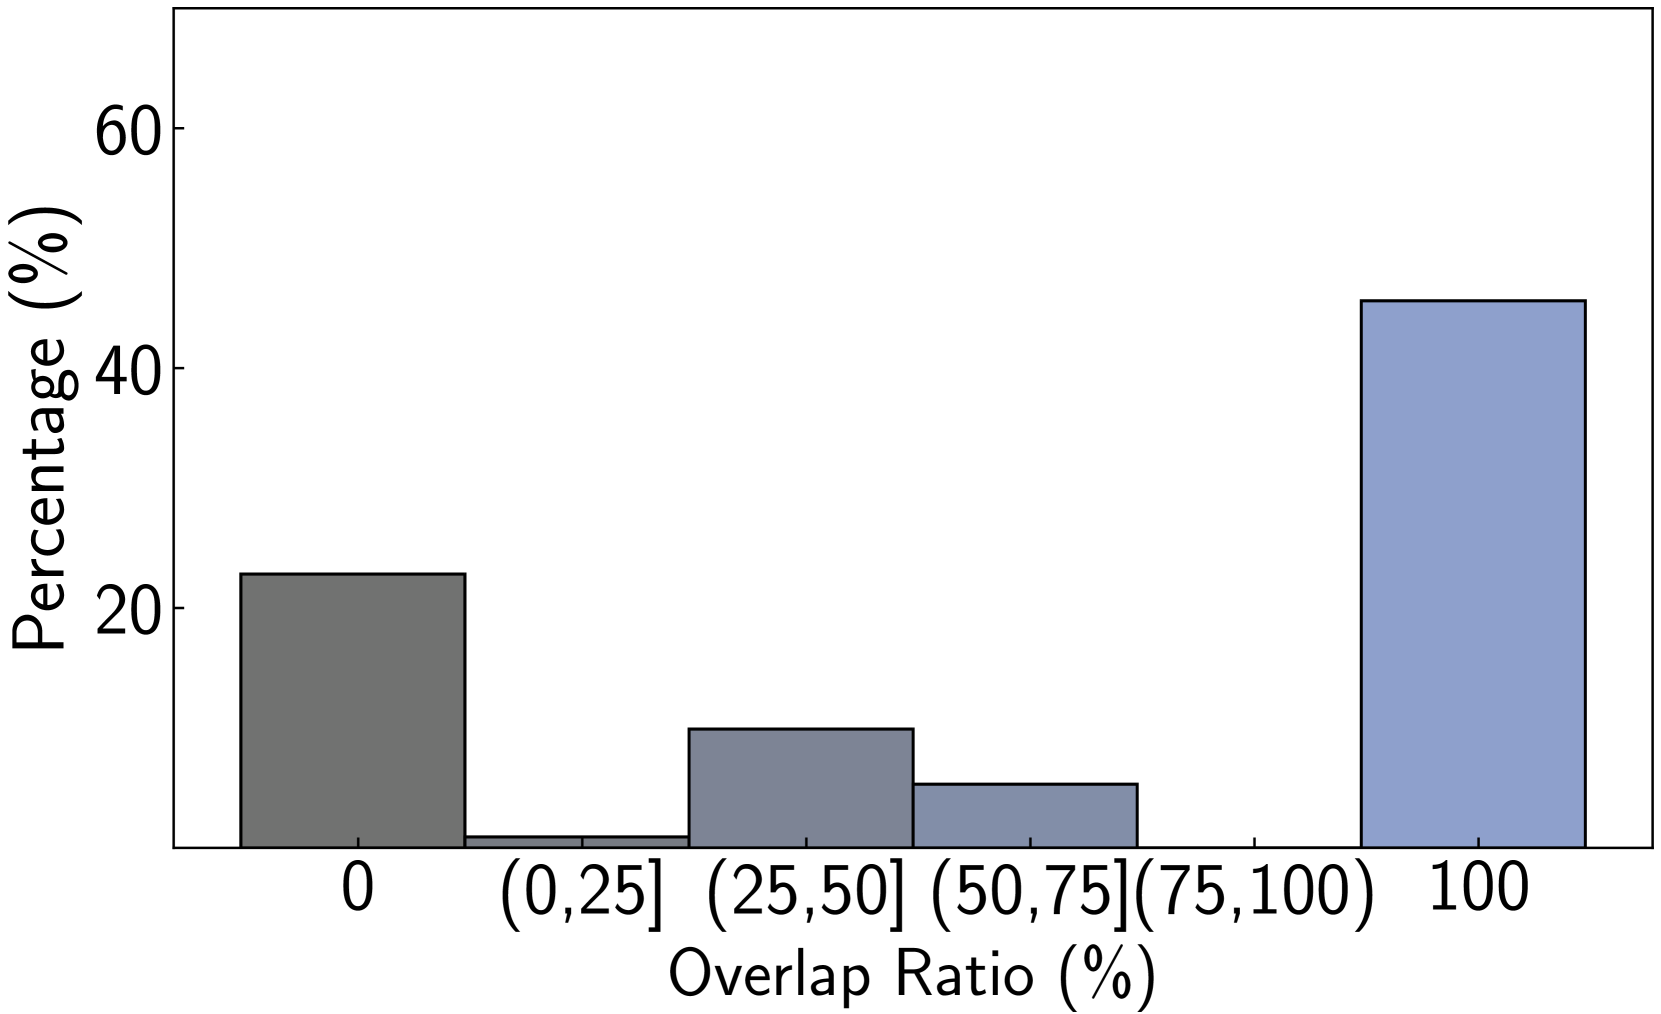
The image presents a bar chart illustrating the distribution of overlap ratios. The x-axis represents the overlap ratio in percentage ranges, and the y-axis represents the percentage of occurrences within each range. The chart shows a bimodal distribution, with a high percentage at 0% overlap and another peak at 100% overlap.
### Components/Axes
* **X-axis Title:** "Overlap Ratio (%)"
* **Y-axis Title:** "Percentage (%)"
* **X-axis Categories:** 0, (0,25], (25,50], (50,75], (75,100], 100
* **Bar Colors:** Dark Gray for 0, (0,25], (25,50], (50,75], (75,100). Light Blue for 100.
### Detailed Analysis
The chart consists of six bars, each representing a different overlap ratio range.
* **Bar 1 (0%):** The bar is dark gray and reaches approximately 23% on the y-axis.
* **Bar 2 ((0,25]%):** The bar is dark gray and reaches approximately 11% on the y-axis.
* **Bar 3 ((25,50]%):** The bar is dark gray and reaches approximately 7% on the y-axis.
* **Bar 4 ((50,75]%):** The bar is dark gray and reaches approximately 3% on the y-axis.
* **Bar 5 ((75,100]%):** The bar is dark gray and reaches approximately 2% on the y-axis.
* **Bar 6 (100%):** The bar is light blue and reaches approximately 44% on the y-axis.
### Key Observations
* The highest percentage of overlap ratios is at 100% (approximately 44%).
* The next highest percentage is at 0% (approximately 23%).
* The percentages decrease as the overlap ratio increases from 0% to 75%.
* The distribution is heavily skewed towards 0% and 100% overlap.
### Interpretation
The data suggests that the analyzed objects or events either have no overlap or complete overlap. The significant peaks at 0% and 100% indicate a binary or extreme behavior in the overlap ratios. This could represent scenarios where objects are either entirely separate or perfectly aligned. The low percentages in the intermediate ranges suggest that partial overlaps are rare. The bimodal distribution implies two distinct populations or processes are contributing to the observed overlap ratios. Further investigation would be needed to understand the underlying reasons for this distribution and the nature of the objects or events being analyzed.