## Bar Chart: Distribution of Overlap Ratios
### Overview
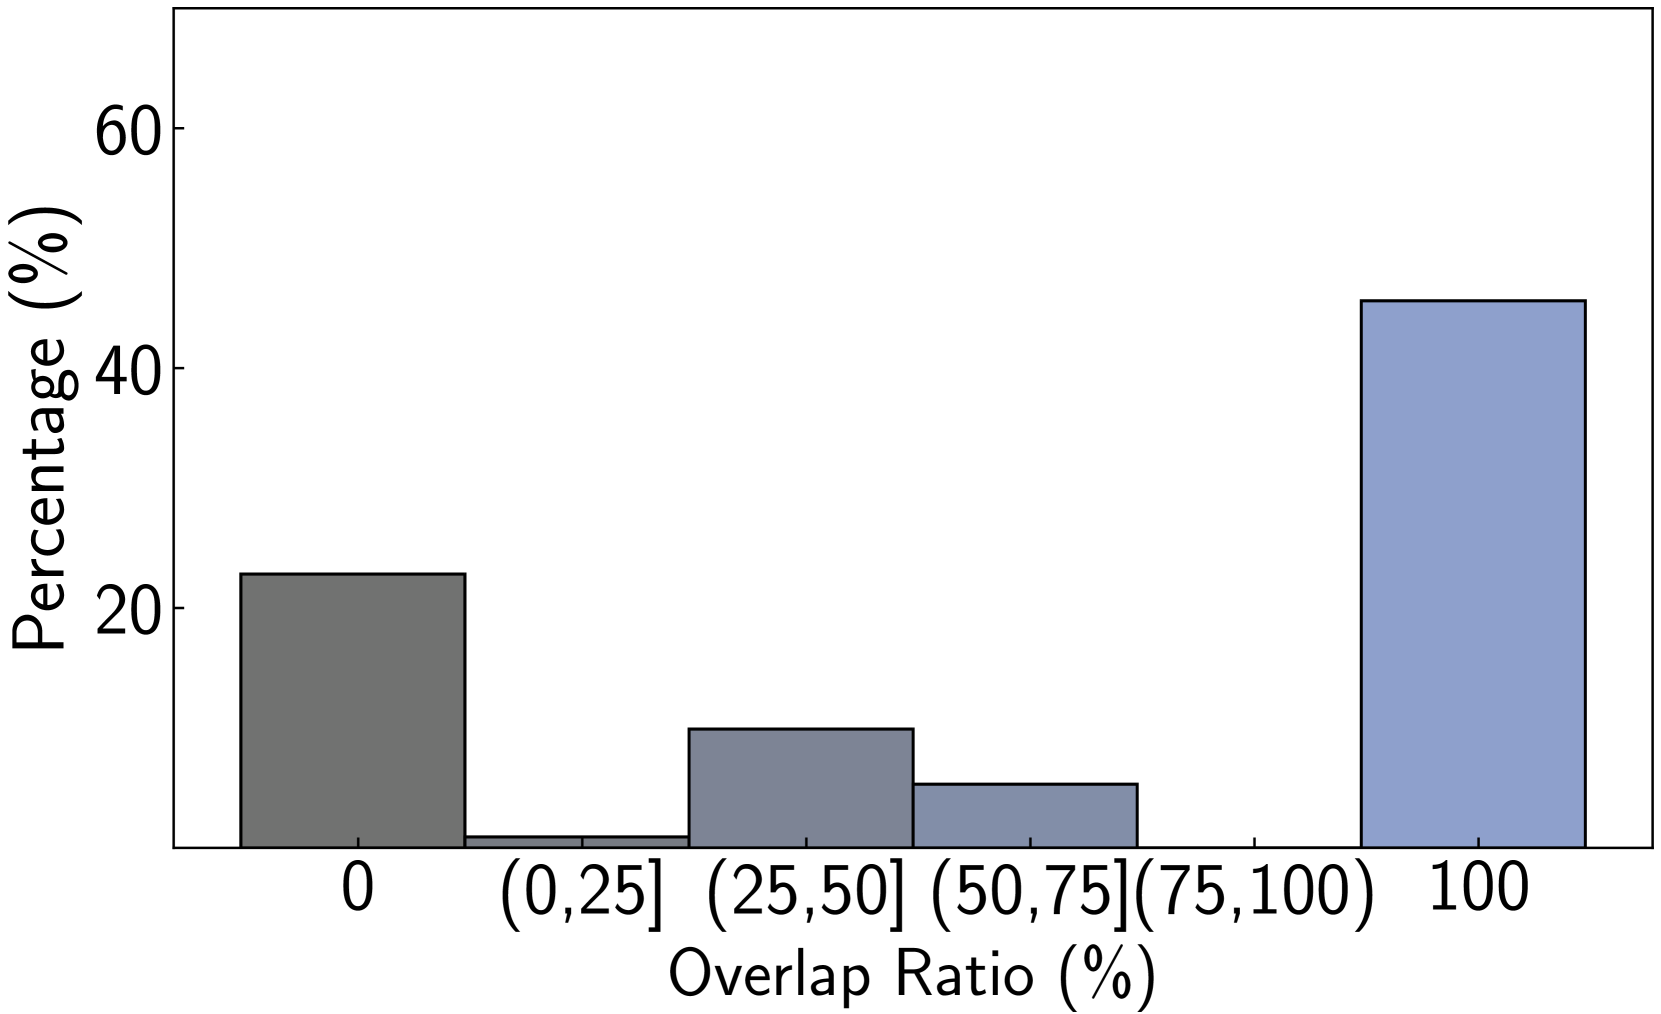
The chart displays a distribution of percentages across different overlap ratio categories. Two prominent bars are visible: one at 0% overlap ratio and another at 100% overlap ratio. The y-axis represents percentage values, while the x-axis categorizes overlap ratios into discrete ranges.
### Components/Axes
- **X-axis (Overlap Ratio (%))**:
Categories:
- `0` (0% overlap)
- `(0,25]` (0–25% overlap)
- `(25,50]` (25–50% overlap)
- `(50,75]` (50–75% overlap)
- `(75,100]` (75–100% overlap)
- `100` (100% overlap)
- **Y-axis (Percentage (%))**:
Scale ranges from 0 to 60% in increments of 20%.
- **Legend**:
Located in the top-right corner. Two colors are used:
- **Gray**: Represents the 0% overlap category.
- **Blue**: Represents the 100% overlap category.
### Detailed Analysis
- **0% Overlap (Gray Bar)**:
Positioned at the far left. Approximately **22%** of the data falls into this category.
- **100% Overlap (Blue Bar)**:
Positioned at the far right. Approximately **45%** of the data falls into this category.
- **Intermediate Categories**:
The ranges `(0,25]`, `(25,50]`, `(50,75]`, and `(75,100]` have no visible bars, indicating 0% contribution to the distribution.
### Key Observations
1. **Dominance of 100% Overlap**: The 100% overlap category accounts for nearly half of the total percentage, suggesting a strong concentration of maximum similarity or agreement.
2. **Significant 0% Overlap**: The 0% overlap category represents a notable minority (22%), indicating a subset of data with no overlap.
3. **Absence of Intermediate Values**: No data exists for overlap ratios between 0% and 100%, implying a binary distribution.
### Interpretation
The chart suggests a polarized distribution where data points either fully overlap (100%) or do not overlap at all (0%). The absence of intermediate values could indicate a threshold effect, where overlap is either complete or nonexistent. The 100% overlap category’s dominance (45%) might reflect a system or process optimized for maximum alignment, while the 0% overlap (22%) could represent outliers or edge cases. The lack of data in intermediate ranges raises questions about the underlying mechanism—whether it inherently prevents partial overlap or if the data was filtered to exclude such cases.