## Density Plot: General Text vs. Medical Text
### Overview
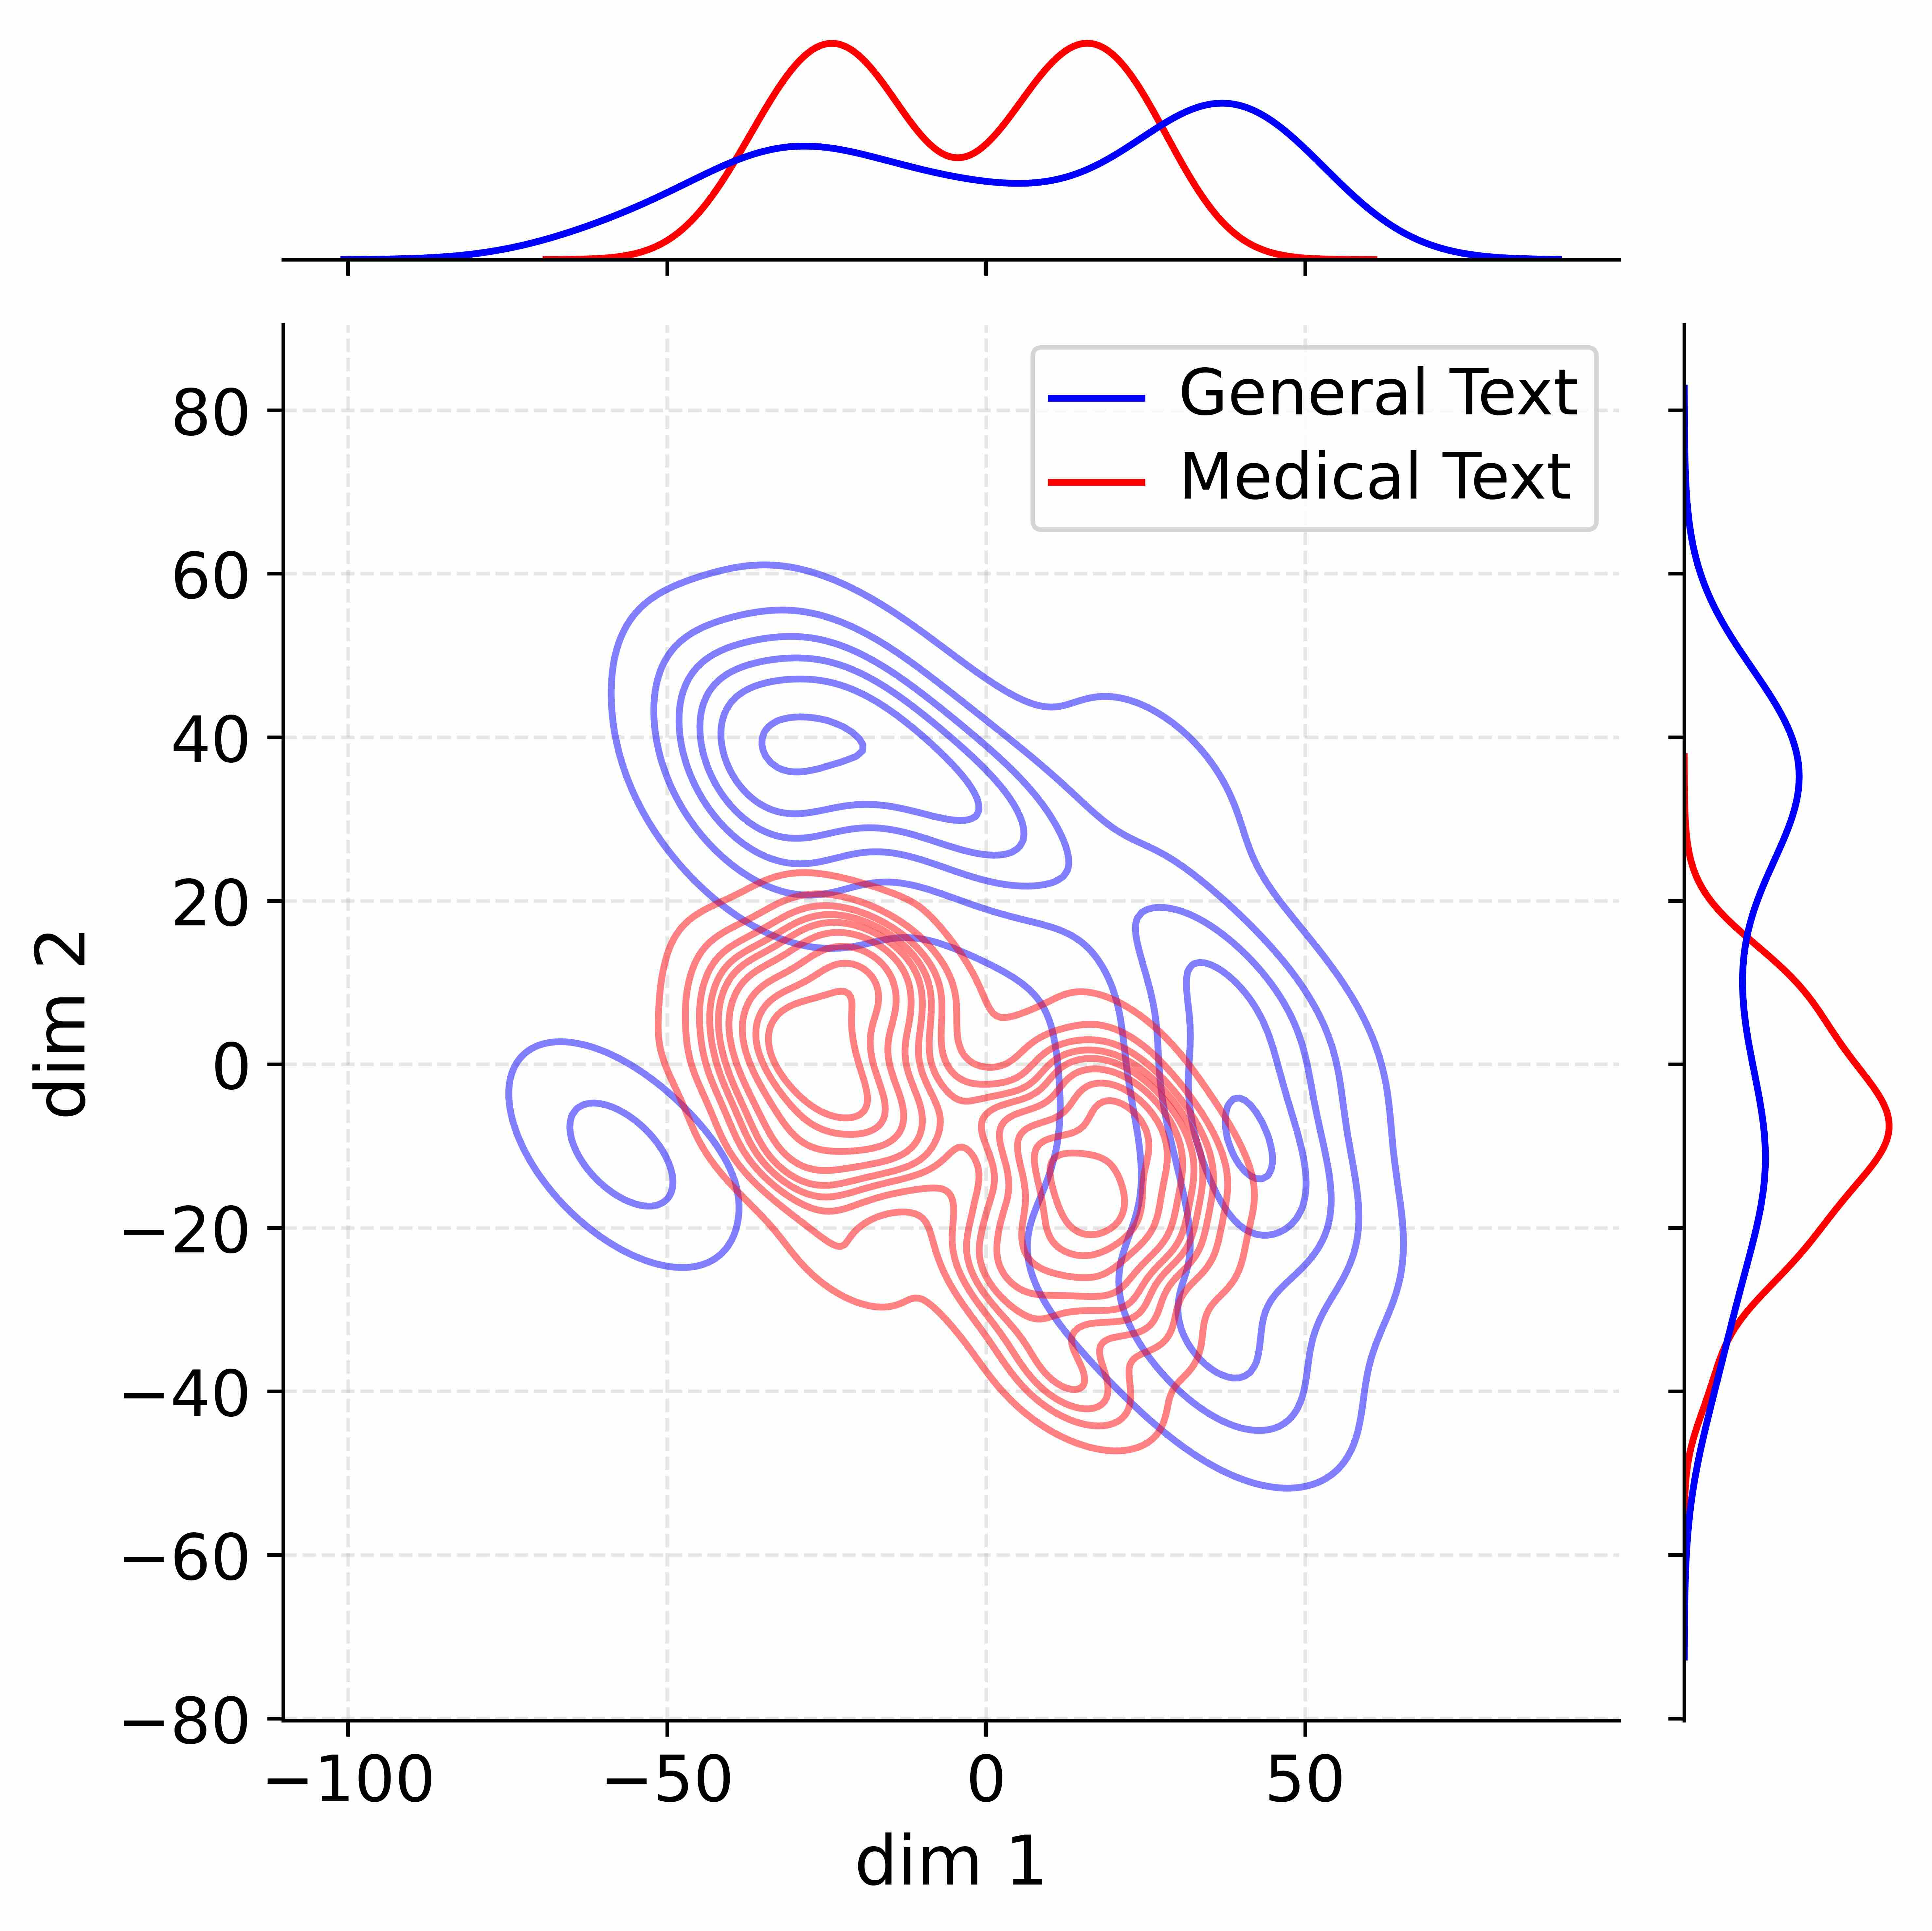
The image is a density plot comparing "General Text" and "Medical Text" across two dimensions (dim 1 and dim 2). It includes a 2D contour plot in the center, with marginal density plots along the top (dim 1) and right side (dim 2). The plot uses blue for "General Text" and red for "Medical Text".
### Components/Axes
* **X-axis (dim 1):** Ranges from -100 to 50, with tick marks at -100, -50, 0, and 50.
* **Y-axis (dim 2):** Ranges from -80 to 80, with tick marks at -80, -60, -40, -20, 0, 20, 40, 60, and 80.
* **Legend (top-center):**
* Blue line: "General Text"
* Red line: "Medical Text"
* **Top Marginal Plot:** Shows the density distribution of dim 1 for both "General Text" (blue) and "Medical Text" (red).
* **Right Marginal Plot:** Shows the density distribution of dim 2 for both "General Text" (blue) and "Medical Text" (red).
* **Grid:** Light gray dashed lines provide visual structure.
### Detailed Analysis
* **General Text (Blue):**
* **2D Contour:** The highest density area is centered around dim 1 = -50 and dim 2 = 40. There's a secondary density area around dim 1 = 50 and dim 2 = 0.
* **Top Marginal Plot (dim 1):** The blue line shows a bimodal distribution, with peaks around -50 and 50.
* **Right Marginal Plot (dim 2):** The blue line shows a unimodal distribution, with a peak around 40.
* **Medical Text (Red):**
* **2D Contour:** The highest density area is centered around dim 1 = 0 and dim 2 = 0.
* **Top Marginal Plot (dim 1):** The red line shows a bimodal distribution, with peaks around -10 and 20.
* **Right Marginal Plot (dim 2):** The red line shows a unimodal distribution, with a peak around 0.
### Key Observations
* "General Text" has higher density in the upper-left and upper-right quadrants, while "Medical Text" is concentrated around the origin.
* The marginal distributions confirm these observations, showing distinct peaks for each type of text along both dimensions.
* The "General Text" distribution along dim 1 is bimodal, suggesting two distinct clusters within the general text data.
* The "Medical Text" distribution along dim 1 is also bimodal, but the peaks are closer together compared to "General Text".
### Interpretation
The density plot visualizes the distribution of "General Text" and "Medical Text" in a two-dimensional space. The separation of the density contours suggests that these two types of text occupy different regions in this space, indicating that they can be distinguished based on the features represented by dim 1 and dim 2. The bimodal distributions along dim 1 for both text types suggest that there are sub-clusters within each category. The "General Text" clusters are more separated than the "Medical Text" clusters, implying greater variability within the "General Text" data.