## Scatter Plot with Contour Distributions: General Text vs Medical Text
### Overview
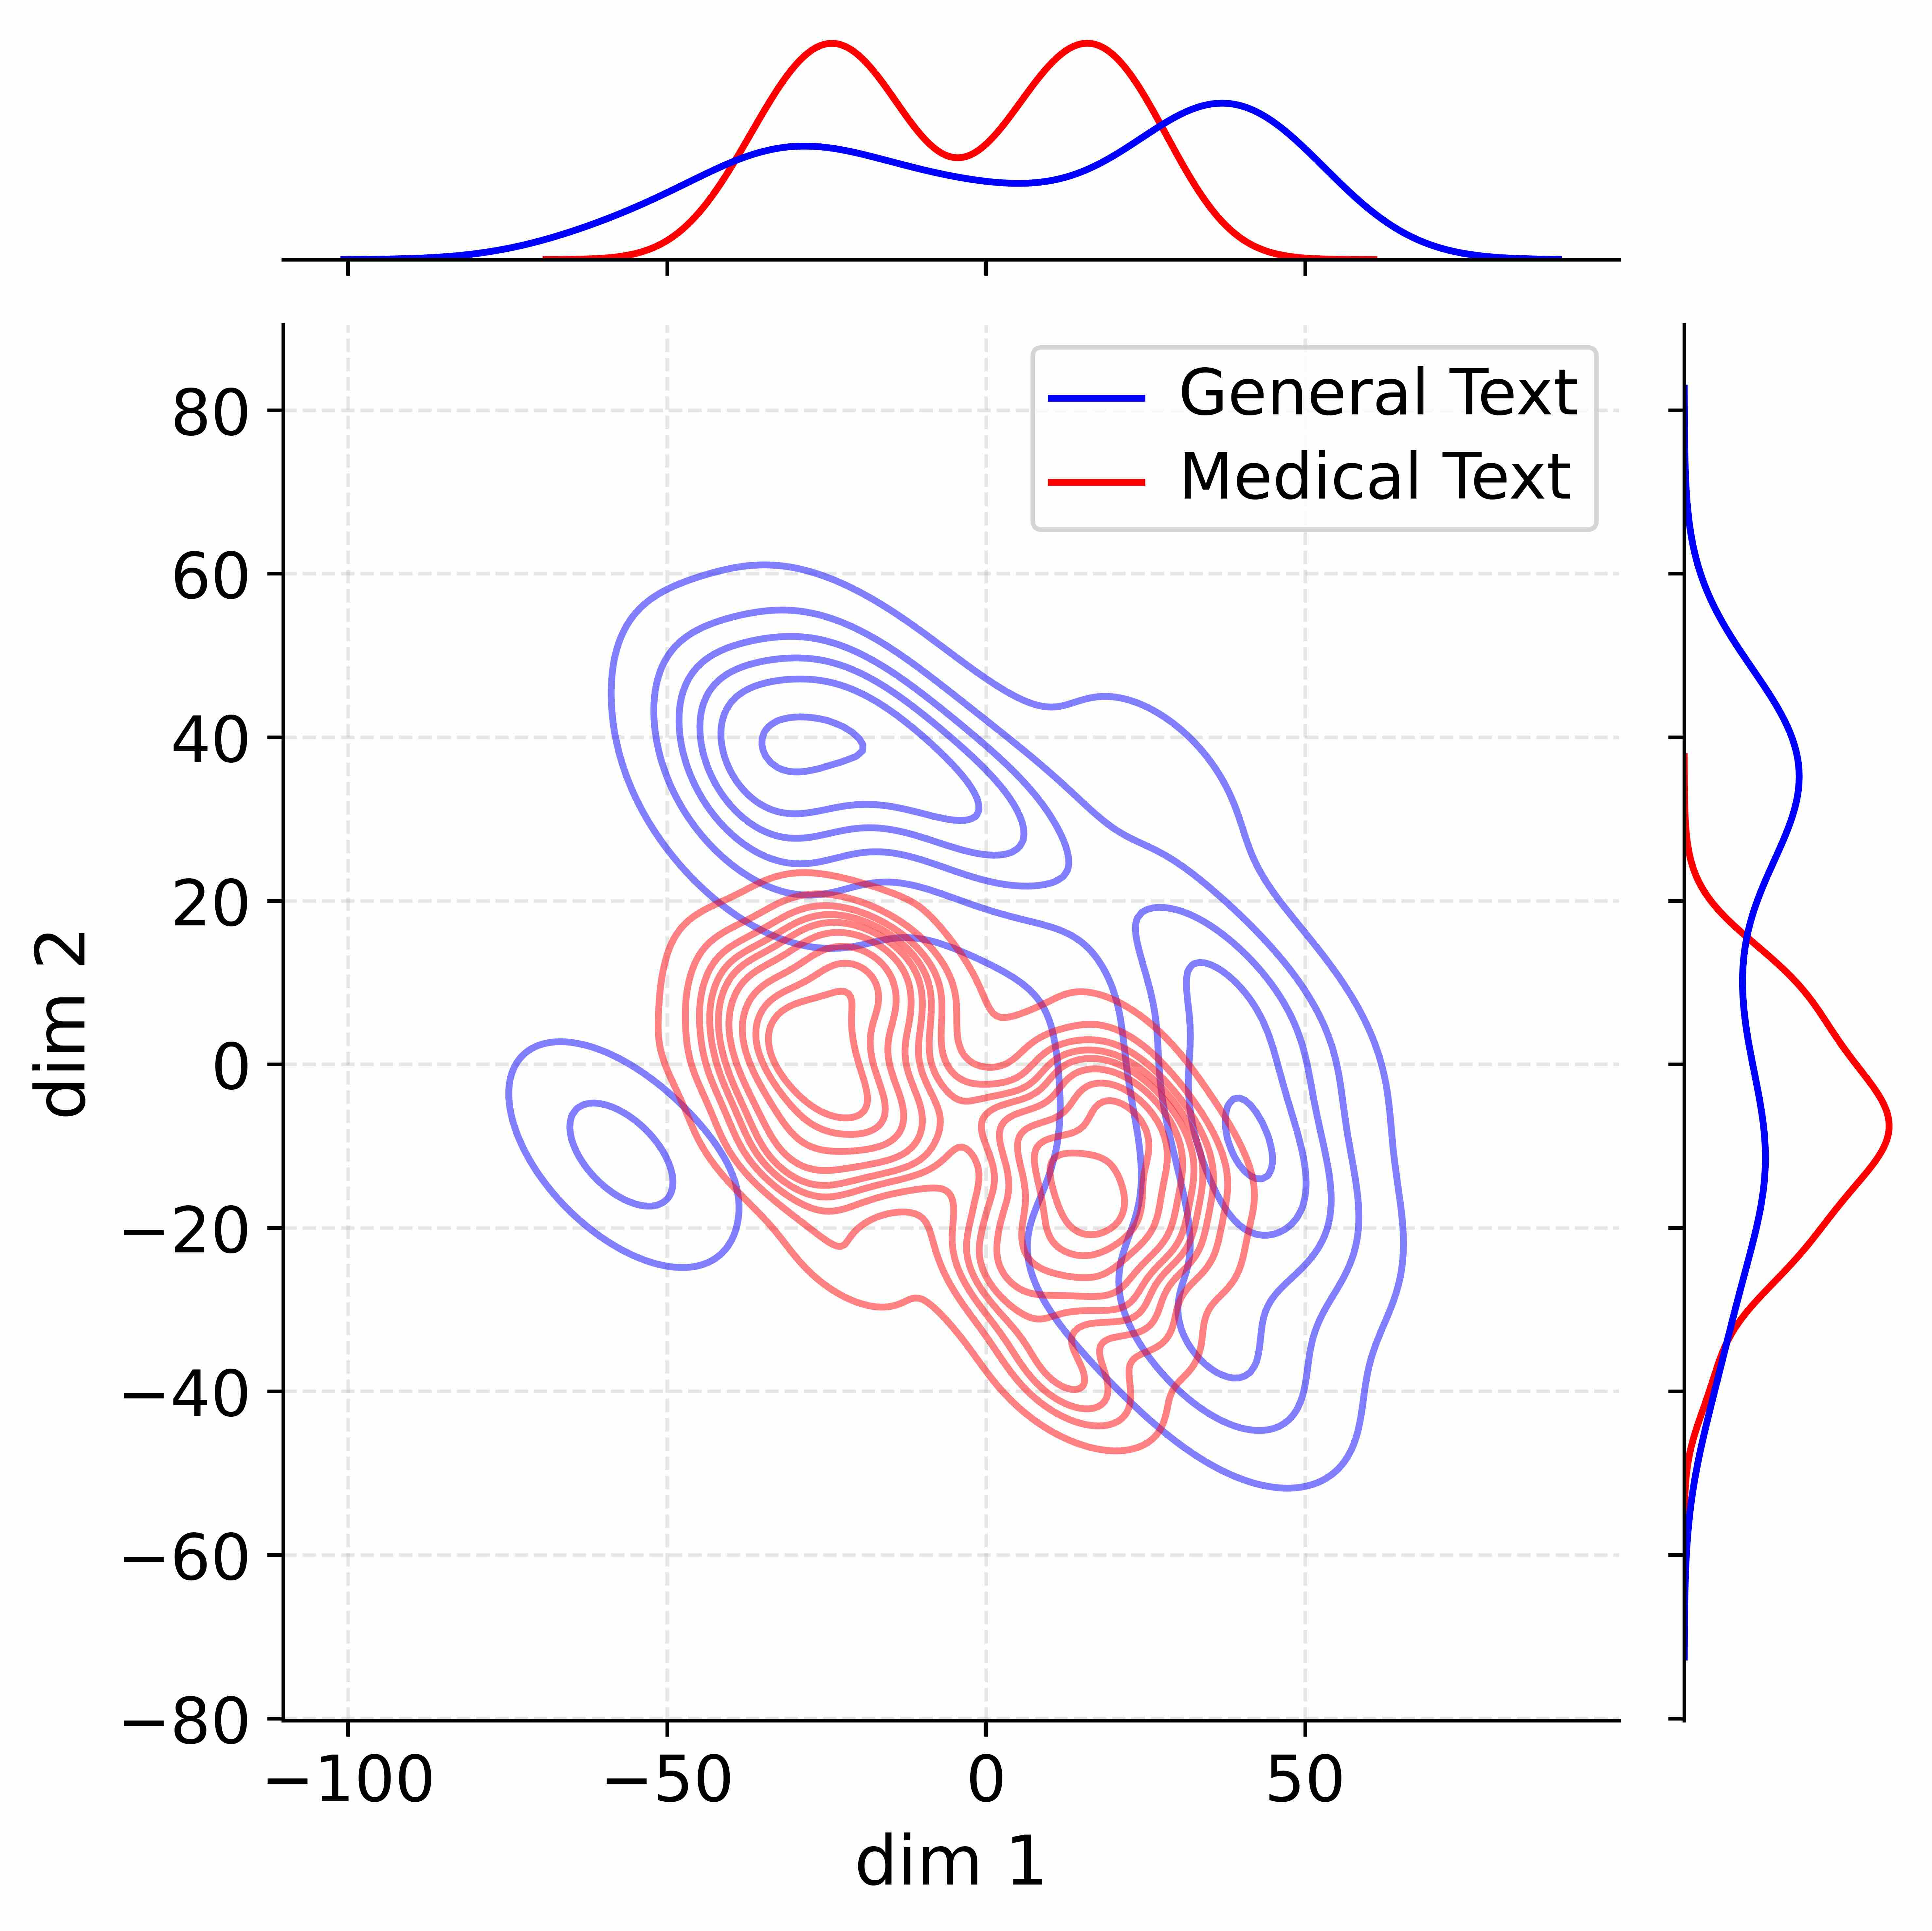
The image presents a 2D scatter plot comparing two data distributions: "General Text" (blue) and "Medical Text" (red). The plot includes contour lines for density estimation and marginal histograms along both axes. The data is visualized in a coordinate system with axes labeled "dim 1" (horizontal) and "dim 2" (vertical).
### Components/Axes
- **Legend**: Located in the top-right corner, with:
- Blue line: "General Text"
- Red line: "Medical Text"
- **Axes**:
- X-axis (dim 1): Ranges from -100 to 100, with gridlines at 20-unit intervals.
- Y-axis (dim 2): Ranges from -80 to 80, with gridlines at 20-unit intervals.
- **Marginal Histograms**:
- Top histogram: Shows distributions along dim 1 for both categories.
- Right histogram: Shows distributions along dim 2 for both categories.
### Detailed Analysis
#### Contour Plot
- **General Text (Blue)**:
- Contours are spread across a wide range of dim 1 (-50 to 50) and dim 2 (-40 to 40).
- Density peaks near dim 1 ≈ -50 and dim 2 ≈ 40.
- Secondary cluster near dim 1 ≈ 50 and dim 2 ≈ -20.
- **Medical Text (Red)**:
- Contours are tightly clustered around dim 1 ≈ 0 and dim 2 ≈ 0.
- Density decreases radially outward from the origin.
- Overlaps with General Text contours in the central region (dim 1: -20 to 20, dim 2: -20 to 20).
#### Marginal Histograms
- **Dim 1 (Top Histogram)**:
- **General Text**: Peaks at dim 1 ≈ -50 and dim 1 ≈ 50.
- **Medical Text**: Single peak at dim 1 ≈ 0.
- **Dim 2 (Right Histogram)**:
- **General Text**: Peaks at dim 2 ≈ 40 and dim 2 ≈ -20.
- **Medical Text**: Single peak at dim 2 ≈ 0.
### Key Observations
1. **Clustering vs Dispersion**:
- Medical Text forms a concentrated cluster near the origin (dim 1 ≈ 0, dim 2 ≈ 0).
- General Text exhibits two distinct clusters and broader dispersion.
2. **Overlap**:
- Significant overlap in the central region (dim 1: -20 to 20, dim 2: -20 to 20).
3. **Histogram Peaks**:
- Medical Text histograms are unimodal, while General Text histograms are bimodal along dim 1 and multimodal along dim 2.
### Interpretation
The data suggests that "Medical Text" is characterized by a central, high-density pattern in the dim 1-dim 2 space, potentially indicating a specific structural or thematic focus. In contrast, "General Text" shows greater variability, with two prominent clusters and a more dispersed distribution. The overlap in the central region implies some shared characteristics between the two categories, but the distinct marginal distributions (e.g., bimodal vs unimodal) highlight fundamental differences in their underlying patterns. The marginal histograms reinforce these observations, showing Medical Text's concentration near zero values and General Text's broader spread. This could reflect differences in content focus, stylistic features, or categorical labeling between the two text types.