## Line Chart: Learning Rate
### Overview
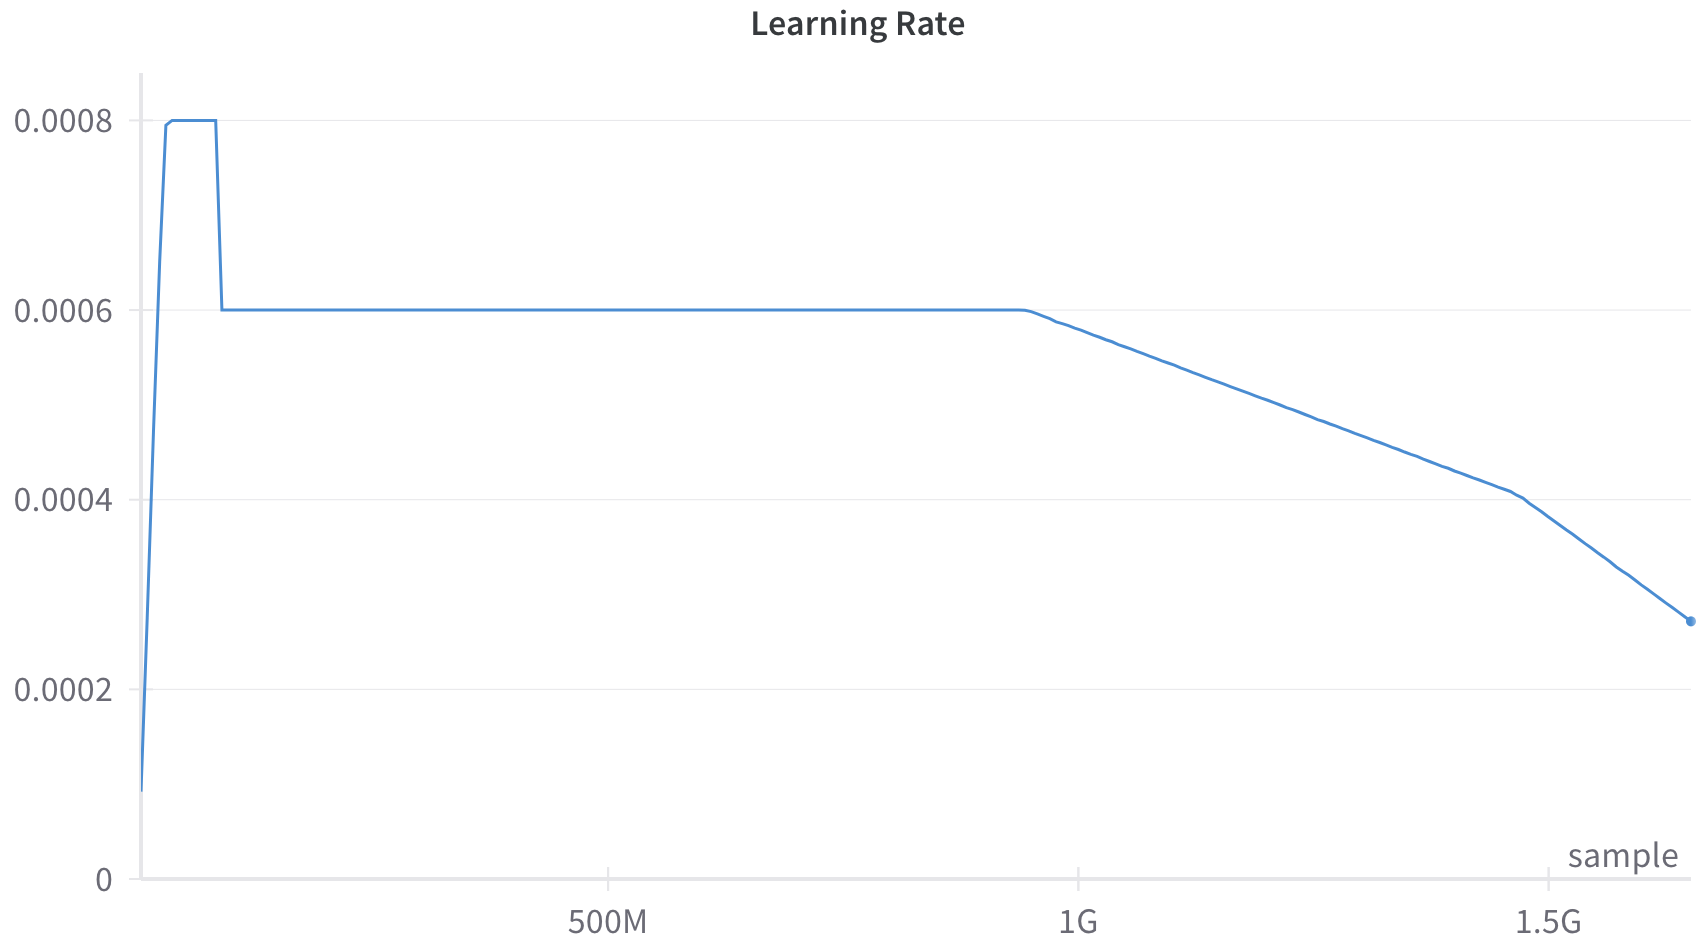
The image is a line chart displaying the learning rate over the course of training, measured in samples. The learning rate initially increases rapidly, plateaus, and then decreases in two stages.
### Components/Axes
* **Title:** Learning Rate
* **X-axis:** sample
* Scale: 0 to 1.5G (1.5 * 10^9), with tick marks at 500M (5 * 10^8) and 1G (1 * 10^9).
* **Y-axis:** Learning Rate
* Scale: 0 to 0.0008, with tick marks at 0.0002 intervals.
### Detailed Analysis
* **Data Series:** The single data series is represented by a blue line.
* **Trend:** The line initially rises sharply, plateaus at approximately 0.0008, then drops to approximately 0.0006, remains constant for a while, and then decreases linearly in two segments.
* **Data Points:**
* Starts near 0.
* Rises sharply to approximately 0.0008 before 500M samples.
* Drops to approximately 0.0006 before 500M samples.
* Remains at approximately 0.0006 until approximately 1G samples.
* Decreases to approximately 0.0004 at approximately 1.5G samples.
* Decreases further to approximately 0.00027 after 1.5G samples.
### Key Observations
* The learning rate experiences an initial rapid increase.
* The learning rate plateaus at two different levels.
* The learning rate decreases linearly in two distinct segments towards the end of the training.
### Interpretation
The chart illustrates a learning rate schedule commonly used in machine learning. The initial rapid increase allows for quick learning at the beginning of training. The plateau phase maintains a consistent learning rate. The final decrease helps to fine-tune the model and avoid overshooting the optimal parameters. The two-stage decrease suggests a more granular approach to fine-tuning, potentially targeting different aspects of the model.