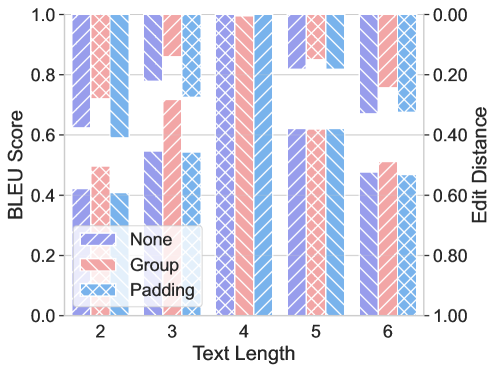
## Bar Chart: BLEU Score and Edit Distance vs. Text Length
### Overview
The image is a bar chart comparing BLEU scores and Edit Distances for different text lengths (2 to 6) under three conditions: "None", "Group", and "Padding". The chart uses a dual y-axis, with the left axis representing BLEU score (ranging from 0.0 to 1.0) and the right axis representing Edit Distance (ranging from 0.00 to 1.00). The x-axis represents Text Length.
### Components/Axes
* **X-axis:** Text Length (2, 3, 4, 5, 6)
* **Left Y-axis:** BLEU Score (0.0, 0.2, 0.4, 0.6, 0.8, 1.0)
* **Right Y-axis:** Edit Distance (0.00, 0.20, 0.40, 0.60, 0.80, 1.00)
* **Legend:** Located in the lower-left corner.
* None (light purple with diagonal lines)
* Group (light red with diagonal lines)
* Padding (light blue with diagonal lines)
### Detailed Analysis
Here's a breakdown of the data for each text length and condition:
* **Text Length 2:**
* None: BLEU Score ~0.42, Edit Distance ~0.58
* Group: BLEU Score ~0.50, Edit Distance ~0.50
* Padding: BLEU Score ~0.40, Edit Distance ~0.60
* **Text Length 3:**
* None: BLEU Score ~0.54, Edit Distance ~0.46
* Group: BLEU Score ~0.70, Edit Distance ~0.30
* Padding: BLEU Score ~0.74, Edit Distance ~0.26
* **Text Length 4:**
* None: BLEU Score ~0.98, Edit Distance ~0.02
* Group: BLEU Score ~0.98, Edit Distance ~0.02
* Padding: BLEU Score ~0.98, Edit Distance ~0.02
* **Text Length 5:**
* None: BLEU Score ~0.62, Edit Distance ~0.38
* Group: BLEU Score ~0.62, Edit Distance ~0.38
* Padding: BLEU Score ~0.90, Edit Distance ~0.10
* **Text Length 6:**
* None: BLEU Score ~0.48, Edit Distance ~0.52
* Group: BLEU Score ~0.50, Edit Distance ~0.50
* Padding: BLEU Score ~0.80, Edit Distance ~0.20
### Key Observations
* For text length 4, all three conditions ("None", "Group", "Padding") achieve near-perfect BLEU scores (close to 1.0) and minimal Edit Distances (close to 0.0).
* "Padding" generally results in higher BLEU scores and lower Edit Distances compared to "None" and "Group", especially for text lengths 5 and 6.
* The BLEU scores for "None" and "Group" conditions are relatively low for text lengths 2, 5, and 6, indicating poorer performance.
### Interpretation
The chart suggests that the "Padding" condition generally improves the quality of the generated text, as indicated by higher BLEU scores and lower Edit Distances. The performance is particularly notable for text length 4, where all conditions perform exceptionally well. The lower scores for "None" and "Group" at certain text lengths suggest that these conditions may not be as effective in maintaining text quality. The relationship between text length and performance varies depending on the condition, indicating that the optimal strategy may depend on the specific text length being considered.