## Bar Chart: BLEU Score and Edit Distance by Text Length
### Overview
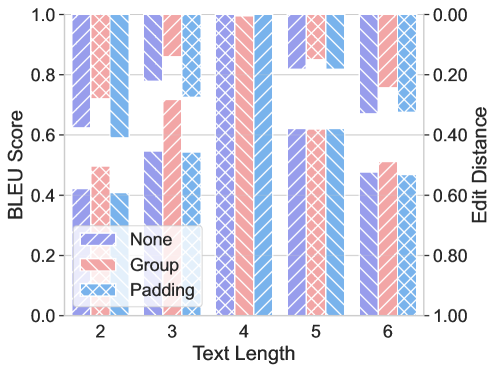
This image displays a grouped bar chart comparing the performance of three different methods ("None", "Group", and "Padding") across five distinct "Text Lengths" (2, 3, 4, 5, and 6). The chart utilizes a dual-axis system to represent two metrics simultaneously: "BLEU Score" on the left vertical axis and "Edit Distance" on the right vertical axis. The data is presented in two distinct horizontal bands: an upper band representing BLEU Scores and a lower band representing Edit Distance.
### Components/Axes
* **X-Axis:** Labeled "Text Length," with discrete categories: 2, 3, 4, 5, 6.
* **Left Y-Axis:** Labeled "BLEU Score," ranging from 0.0 to 1.0.
* **Right Y-Axis:** Labeled "Edit Distance," ranging from 0.00 (top) to 1.00 (bottom). Note that this axis is inverted.
* **Legend:** Located in the bottom-left quadrant.
* **None:** Purple bars with diagonal stripes (top-left to bottom-right).
* **Group:** Pink/Red bars with cross-hatch pattern.
* **Padding:** Blue bars with diagonal stripes (top-right to bottom-left).
### Detailed Analysis
The chart is segmented into two visual tiers. The upper tier corresponds to the BLEU Score (0.6–1.0), and the lower tier corresponds to the Edit Distance (0.4–0.6 on the left axis, which maps to 0.6–0.4 on the right axis).
**Data Points (Approximate Values):**
| Text Length | Metric | None | Group | Padding |
| :--- | :--- | :--- | :--- | :--- |
| **2** | BLEU (Upper) | ≈ 0.63 | ≈ 0.72 | ≈ 0.60 |
| **2** | Edit Distance (Lower) | ≈ 0.42 | ≈ 0.50 | ≈ 0.41 |
| **3** | BLEU (Upper) | ≈ 0.78 | ≈ 0.72 | ≈ 0.73 |
| **3** | Edit Distance (Lower) | ≈ 0.55 | ≈ 0.72 | ≈ 0.55 |
| **4** | BLEU (Upper) | 1.0 | 1.0 | 1.0 |
| **4** | Edit Distance (Lower) | 0.0 | 0.0 | 0.0 |
| **5** | BLEU (Upper) | ≈ 1.0 | ≈ 0.85 | ≈ 1.0 |
| **5** | Edit Distance (Lower) | ≈ 0.62 | ≈ 0.62 | ≈ 0.62 |
| **6** | BLEU (Upper) | ≈ 1.0 | ≈ 0.76 | ≈ 1.0 |
| **6** | Edit Distance (Lower) | ≈ 0.48 | ≈ 0.51 | ≈ 0.48 |
### Key Observations
* **The "Length 4" Anomaly:** Text Length 4 acts as a perfect performance point for all three methods, achieving a maximum BLEU score of 1.0 and a minimum Edit Distance of 0.0.
* **Method Consistency:** The "None" and "Padding" methods consistently track each other very closely across all text lengths.
* **"Group" Method Variance:** The "Group" method shows the most volatility. It outperforms the others at Length 2 (higher BLEU, higher Edit Distance) but underperforms compared to "None" and "Padding" at Lengths 3, 5, and 6.
* **Dual-Axis Inversion:** The right axis (Edit Distance) is inverted, meaning higher bars in the lower section represent a *higher* Edit Distance (worse performance), while lower bars represent a *lower* Edit Distance (better performance).
### Interpretation
The data suggests that the "Group" method introduces a specific bias or behavior that is highly sensitive to text length. While it provides a slight advantage at Length 2, it consistently degrades performance (lower BLEU, higher Edit Distance) at lengths 3, 5, and 6 compared to the baseline "None" and "Padding" methods.
The perfect performance at Text Length 4 is a significant outlier, suggesting that the underlying model or task may have a specific structural alignment or "sweet spot" at this length, rendering the differences between the methods negligible. The "None" and "Padding" methods appear to be robust, stable baselines, whereas the "Group" method appears to be an experimental intervention that does not consistently improve performance across the tested lengths.