## Dual-Axis Grouped Bar Chart: BLEU Score and Edit Distance by Text Length
### Overview
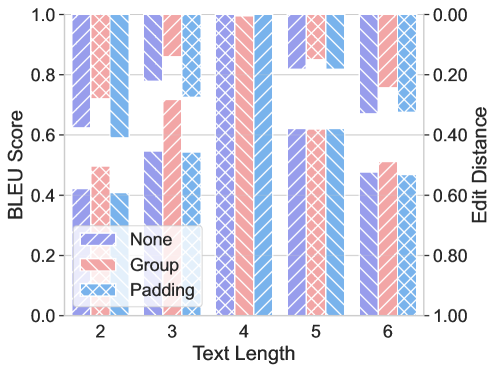
This image displays a grouped bar chart with dual vertical axes, comparing three different methods ("None", "Group", "Padding") across five discrete text lengths (2, 3, 4, 5, 6). The chart measures two distinct performance metrics simultaneously: BLEU Score (left axis) and Edit Distance (right axis). The bars for each method are visually distinguished by color and pattern.
### Components/Axes
* **Chart Type:** Grouped Bar Chart with Dual Y-Axes.
* **X-Axis:**
* **Label:** "Text Length"
* **Categories/Ticks:** 2, 3, 4, 5, 6
* **Primary Y-Axis (Left):**
* **Label:** "BLEU Score"
* **Scale:** Linear, from 0.0 to 1.0.
* **Ticks:** 0.0, 0.2, 0.4, 0.6, 0.8, 1.0
* **Secondary Y-Axis (Right):**
* **Label:** "Edit Distance"
* **Scale:** Linear, but **inverted** (0.00 at top, 1.00 at bottom).
* **Ticks:** 0.00, 0.20, 0.40, 0.60, 0.80, 1.00
* **Legend:**
* **Position:** Bottom-left corner of the plot area.
* **Items:**
1. **None:** Purple bar with diagonal hatching (\\).
2. **Group:** Red bar with cross-hatching (X).
3. **Padding:** Blue bar with diamond/checkerboard hatching.
* **Data Representation:** For each text length on the x-axis, three bars are grouped together, one for each method in the legend. The height of each bar corresponds to the BLEU Score (read from the left axis). The same bar's vertical position from the top corresponds to the Edit Distance (read from the inverted right axis).
### Detailed Analysis
**Data Point Extraction (Approximate Values):**
Values are estimated based on bar height/position relative to the axes. The dual-axis nature means each bar encodes two values.
| Text Length | Method | BLEU Score (Left Axis) | Edit Distance (Right Axis) |
| :--- | :--- | :--- | :--- |
| **2** | None | ~0.42 | ~0.58 |
| | Group | ~0.49 | ~0.51 |
| | Padding | ~0.41 | ~0.59 |
| **3** | None | ~0.55 | ~0.45 |
| | Group | ~0.72 | ~0.28 |
| | Padding | ~0.54 | ~0.46 |
| **4** | None | ~0.80 | ~0.20 |
| | Group | **~1.00** | **~0.00** |
| | Padding | ~0.80 | ~0.20 |
| **5** | None | ~0.62 | ~0.38 |
| | Group | ~0.62 | ~0.38 |
| | Padding | ~0.62 | ~0.38 |
| **6** | None | ~0.48 | ~0.52 |
| | Group | ~0.51 | ~0.49 |
| | Padding | ~0.47 | ~0.53 |
**Trend Verification:**
* **BLEU Score Trend (Left Axis):** For all methods, the score generally increases from length 2 to a peak at length 4, then decreases at lengths 5 and 6. The "Group" method shows the most dramatic peak.
* **Edit Distance Trend (Right Axis, Inverted):** Because the axis is inverted, a *lower* bar visually indicates a *higher* Edit Distance value. The trend is inverse to BLEU Score: Edit Distance is lowest (best) at length 4 and higher (worse) at lengths 2, 5, and 6. "Group" achieves the best (lowest) Edit Distance at length 4.
### Key Observations
1. **Peak Performance at Length 4:** All methods achieve their best combined performance (highest BLEU, lowest Edit Distance) at a text length of 4. The "Group" method reaches a perfect BLEU Score of 1.0 and an Edit Distance of 0.00 at this point.
2. **"Group" Method Superiority:** The "Group" method (red, cross-hatched) consistently outperforms or matches the other two methods across all text lengths for both metrics, with the most significant advantage at lengths 3 and 4.
3. **Convergence at Length 5:** At text length 5, all three methods show nearly identical performance for both BLEU Score (~0.62) and Edit Distance (~0.38).
4. **Performance Degradation with Length:** Beyond the optimal length of 4, performance for all methods degrades as text length increases to 5 and 6, indicated by falling BLEU Scores and rising Edit Distances.
5. **"None" and "Padding" Similarity:** The "None" (purple) and "Padding" (blue) methods exhibit very similar performance profiles across all text lengths, often with values within 0.01-0.02 of each other.
### Interpretation
This chart likely evaluates different text processing or generation strategies ("None", "Group", "Padding") on tasks where output quality is measured by both similarity to a reference (BLEU) and amount of correction needed (Edit Distance). The inverted Edit Distance axis cleverly aligns "better" performance (lower distance) with a higher visual position on the chart, making it intuitive to see that the tallest bars represent the best overall results.
The data suggests a "sweet spot" at a text length of 4, where the task is neither too short (lacking context) nor too long (introducing complexity or error propagation). The "Group" method's exceptional performance at this length implies it is particularly effective at leveraging structure or context within sequences of this moderate length. The convergence of all methods at length 5 and their subsequent decline at length 6 indicates that for longer sequences, the choice of method becomes less critical, and the inherent difficulty of the task dominates. The near-identical performance of "None" and "Padding" suggests that simple padding offers no significant advantage over doing nothing for this specific task and metric set.