## Bar Chart: BLEU Score vs. Text Length with Grouping and Padding
### Overview
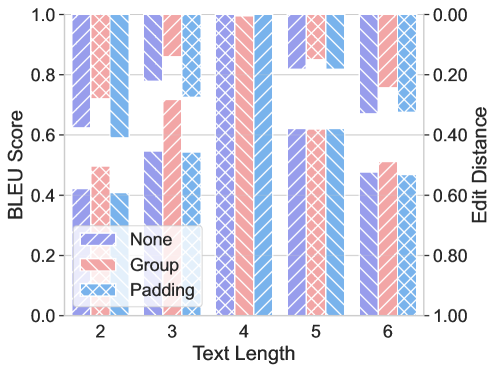
The image is a grouped bar chart comparing BLEU scores across different text lengths (2–6) for three categories: "None," "Group," and "Padding." A secondary y-axis labeled "Edit Distance" is present on the right, but no bars align with it, suggesting it may represent a separate metric or be a placeholder. The chart uses diagonal hatch patterns (crosshatch) to differentiate categories, with a legend at the bottom left.
---
### Components/Axes
- **X-axis (Text Length)**: Discrete categories labeled 2, 3, 4, 5, 6.
- **Y-axis (BLEU Score)**: Continuous scale from 0.0 to 1.0.
- **Secondary Y-axis (Edit Distance)**: Continuous scale from 0.0 to 1.0, but no bars are plotted against it.
- **Legend**: Located at the bottom left, with three categories:
- **None** (purple, diagonal hatch)
- **Group** (red, diagonal hatch)
- **Padding** (blue, diagonal hatch)
---
### Detailed Analysis
#### BLEU Score Trends
- **Text Length 2**:
- None: ~0.4
- Group: ~0.5
- Padding: ~0.3
- **Text Length 3**:
- None: ~0.6
- Group: ~0.7
- Padding: ~0.5
- **Text Length 4**:
- None: ~0.8
- Group: ~0.9
- Padding: ~0.7
- **Text Length 5**:
- None: ~0.6
- Group: ~0.7
- Padding: ~0.5
- **Text Length 6**:
- None: ~0.5
- Group: ~0.6
- Padding: ~0.4
#### Edit Distance Axis
- No bars are plotted against the Edit Distance axis, which ranges from 0.0 to 1.0. This suggests it may represent a separate metric (e.g., edit distance between original and modified text) but is not visually linked to the BLEU score bars.
---
### Key Observations
1. **BLEU Score Variability**:
- BLEU scores generally increase with text length up to 4, then decline.
- The "Group" category consistently outperforms "None" and "Padding" across most text lengths.
- "Padding" shows the lowest scores, particularly at text lengths 2 and 6.
2. **Edit Distance Discrepancy**:
- The Edit Distance axis is present but unutilized, indicating potential missing data or a design oversight.
3. **Hatch Patterns**:
- Diagonal hatches (crosshatch) are used to differentiate categories, but the legend clarifies the color-coding.
---
### Interpretation
- **Performance Insights**:
- The "Group" category (red) demonstrates the highest BLEU scores, suggesting it may represent a more effective text processing method (e.g., grouping related terms).
- "Padding" (blue) underperforms, possibly due to irrelevant or redundant text additions.
- The decline in scores for longer text lengths (5–6) could indicate overfitting or noise in longer sequences.
- **Design Considerations**:
- The secondary Edit Distance axis lacks corresponding data, raising questions about its purpose.
- The use of hatch patterns for differentiation is effective but could be supplemented with clearer color coding for accessibility.
- **Uncertainties**:
- Exact BLEU scores are approximate due to the lack of numerical labels on the bars.
- The relationship between Edit Distance and BLEU Score remains unclear without additional data.
This chart highlights the impact of text length and grouping strategies on BLEU scores, with "Group" emerging as the most effective approach. Further analysis of the Edit Distance metric is needed to fully contextualize the results.