## Diagram: Two-Row Simulation of a Process
### Overview
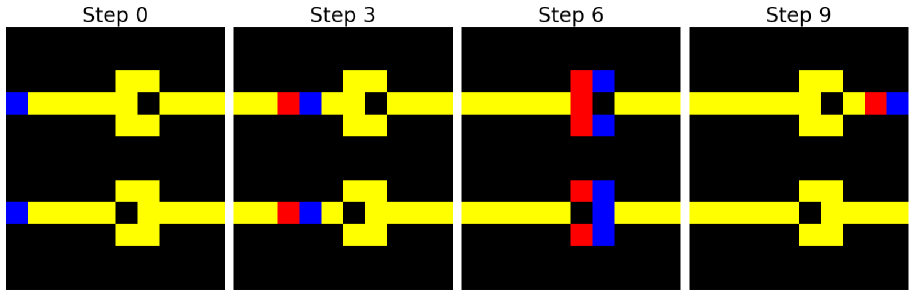
The image shows a simulation across two rows, depicting the state of a process at four different steps: Step 0, Step 3, Step 6, and Step 9. Each step shows two parallel rows. The simulation involves movement of colored blocks (blue and red) along a yellow path within a black background.
### Components/Axes
* **Titles:** Step 0, Step 3, Step 6, Step 9 (placed above each column)
* **Environment:** Black background
* **Path:** Yellow horizontal path with a square-shaped obstacle in the middle.
* **Movable Blocks:** Blue and Red blocks.
### Detailed Analysis
**Step 0:**
* Both rows show a blue block at the left end of the yellow path.
**Step 3:**
* In both rows, the blue block has moved to the right, and a red block appears to its left. The red and blue blocks are adjacent.
**Step 6:**
* In both rows, the red and blue blocks have moved further right and are now positioned vertically, blocking the yellow path. The red block is above the blue block.
**Step 9:**
* In both rows, the red and blue blocks have moved further to the right, past the central square obstacle, with the red block to the left and the blue block to the right.
### Key Observations
* The simulation shows the progression of blue and red blocks along a defined path.
* The blocks move together, maintaining a relative position.
* At Step 6, the blocks are oriented vertically, blocking the path.
### Interpretation
The diagram illustrates a process where two components (represented by the blue and red blocks) move along a path, interact with an obstacle, and continue moving. The simulation demonstrates a state change at Step 6, where the components temporarily block the path. The two rows likely represent parallel or redundant processes, as they exhibit identical behavior at each step.