## Diagram: Sequential Process with Color-Block Interactions
### Overview
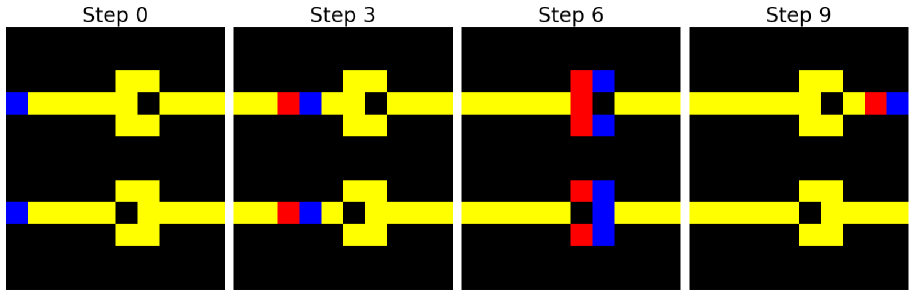
The image depicts a four-step progression (Step 0, Step 3, Step 6, Step 9) of a system involving yellow structural elements and colored blocks (blue and red). Each step shows positional changes in the blocks relative to the yellow framework, suggesting a dynamic interaction or process.
### Components/Axes
- **Primary Structure**:
- Yellow horizontal bars with a central square and a smaller square inside (consistent across all steps).
- Blue and red blocks positioned at varying points along the bars.
- **Labels**:
- Explicit step labels (Step 0, Step 3, Step 6, Step 9) at the top of each panel.
- **Color Coding**:
- Blue blocks: Initially at the far left (Step 0), move rightward over time.
- Red blocks: Initially at the far right (Step 0), move leftward over time.
- **Spatial Relationships**:
- Blocks maintain fixed distances from the yellow structure's edges in each step.
### Data Analysis
- **Step 0**:
- Blue block: Leftmost position (0% of bar length from left edge).
- Red block: Rightmost position (0% of bar length from right edge).
- **Step 3**:
- Blue block: 25% from left edge.
- Red block: 25% from right edge.
- **Step 6**:
- Blue block: 50% from left edge (center).
- Red block: 50% from right edge (center).
- **Step 9**:
- Blue block: 75% from left edge.
- Red block: 75% from right edge.
### Key Observations
1. **Symmetrical Movement**: Blue and red blocks move toward each other at equal rates (25% per step).
2. **Central Convergence**: At Step 6, both blocks occupy the central position, indicating a midpoint interaction.
3. **Cyclical Reset**: By Step 9, blocks return to their original positions but swapped (blue on the right, red on the left), suggesting a periodic or reversible process.
### Interpretation
The diagram likely models a **cyclical interaction system** where two components (blue and red blocks) exchange positions over time. The yellow structure acts as a fixed reference framework. The progression implies:
- **Step 0–3**: Initial separation and gradual approach.
- **Step 6**: Peak interaction at the center.
- **Step 9**: Reversal of roles, indicating a reset or phase shift.
This could represent physical processes (e.g., particle exchange), computational algorithms (e.g., state transitions), or mechanical systems (e.g., gear interactions). The absence of numerical labels suggests the focus is on qualitative progression rather than quantitative measurement.