## Heatmap: Matrix of Values
### Overview
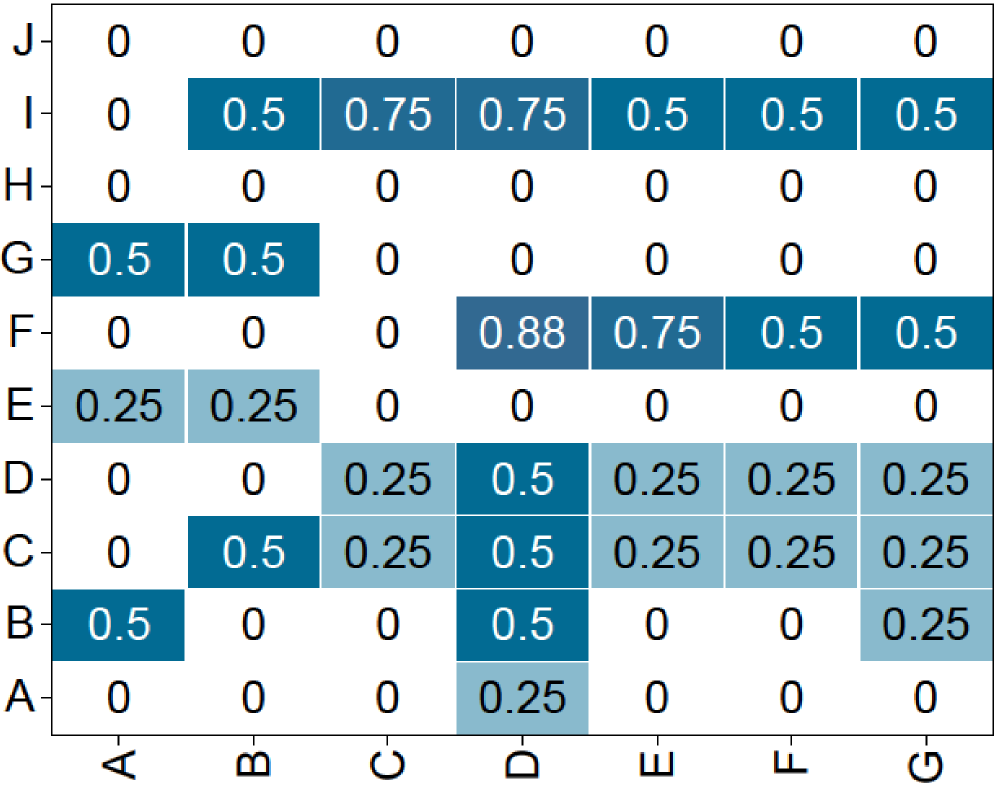
The image is a heatmap representing a matrix of numerical values. The rows are labeled A through J, and the columns are labeled A through G. Each cell in the matrix is colored based on its value, with darker shades of blue indicating higher values and lighter shades indicating lower values.
### Components/Axes
* **Rows:** Labeled A, B, C, D, E, F, G, H, I, J (from bottom to top)
* **Columns:** Labeled A, B, C, D, E, F, G (from left to right)
* **Values:** Represented by the color of each cell, ranging from 0 to 0.88. The color gradient goes from light blue (0) to dark blue (0.88).
### Detailed Analysis or Content Details
Here's a breakdown of the values in the matrix:
* **Row J:** All values are 0.
* **Row I:** 0, 0.5, 0.75, 0.75, 0.5, 0.5, 0.5
* **Row H:** All values are 0.
* **Row G:** 0.5, 0.5, 0, 0, 0, 0, 0
* **Row F:** 0, 0, 0, 0.88, 0.75, 0.5, 0.5
* **Row E:** 0.25, 0.25, 0, 0, 0, 0, 0
* **Row D:** 0, 0, 0.25, 0.5, 0.25, 0.25, 0.25
* **Row C:** 0, 0.5, 0.25, 0.5, 0.25, 0.25, 0.25
* **Row B:** 0.5, 0, 0, 0.5, 0, 0, 0.25
* **Row A:** All values are 0, except for column D which has a value of 0.25.
### Key Observations
* Row J and Row H have all values as 0.
* Row F has the highest value of 0.88 in column D.
* The values in the matrix are concentrated between 0 and 0.88.
* The values are not uniformly distributed, with some rows and columns having more non-zero values than others.
### Interpretation
The heatmap visualizes the relationships between the rows and columns based on the numerical values. The darker the color, the stronger the relationship. The data suggests that there are some strong relationships between certain row-column pairs (e.g., Row F and Column D), while others have no relationship (e.g., Row J and all columns). This could represent various types of data, such as correlation coefficients, interaction strengths, or similarity scores, depending on the context. The matrix is not symmetrical, indicating that the relationship between row X and column Y is not necessarily the same as the relationship between row Y and column X.