## Heatmap: Matrix of Numerical Values
### Overview
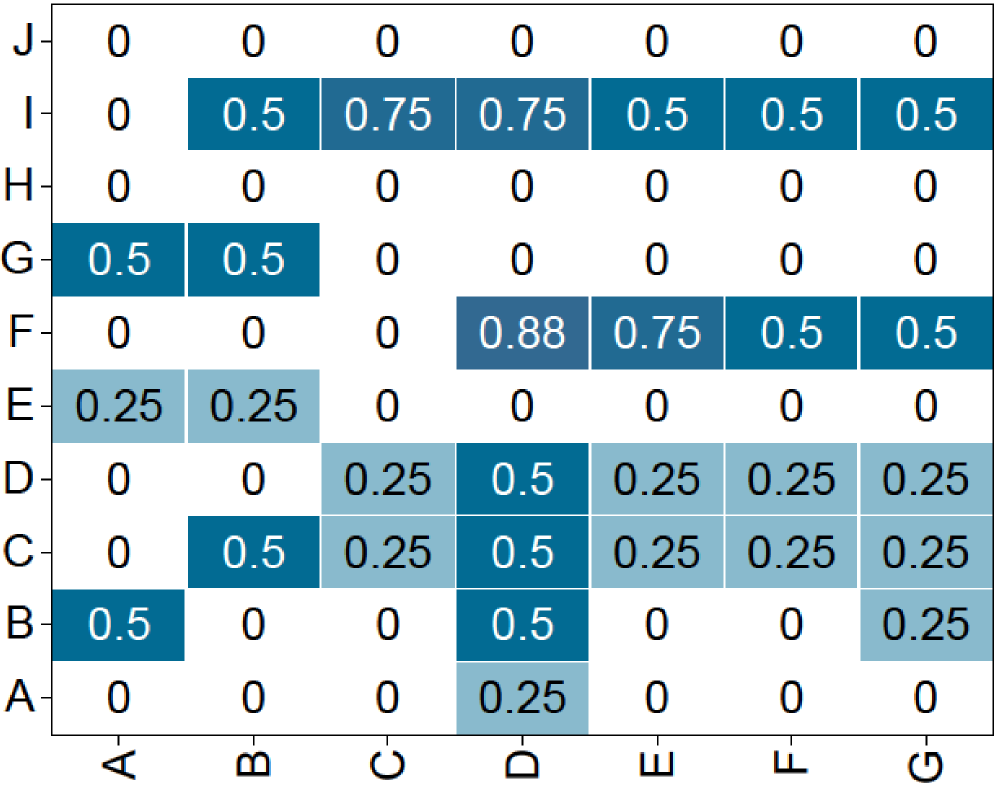
The image is a 10x7 grid (rows A-J, columns A-G) with numerical values (0, 0.25, 0.5, 0.75, 0.88) and color-coded cells. Darker blue shades represent higher values, while lighter blue or white cells indicate lower or zero values. No explicit legend is present, but color intensity correlates with magnitude.
### Components/Axes
- **Rows**: Labeled A (top) to J (bottom).
- **Columns**: Labeled A (left) to G (right).
- **Values**: Numerical annotations in each cell (e.g., 0.5, 0.75, 0.88).
- **Color Coding**:
- Dark blue: High values (e.g., 0.88, 0.75).
- Medium blue: Moderate values (e.g., 0.5).
- Light blue: Low values (e.g., 0.25).
- White: Zero values.
### Detailed Analysis
- **Highest Value**: 0.88 in cell **F-D** (row F, column D).
- **Cluster of 0.75s**:
- Row **I**: Columns B (0.5), C (0.75), D (0.75), G (0.5).
- Row **F**: Columns D (0.88), E (0.75), F (0.5), G (0.5).
- **0.5s**:
- Row **G**: Columns A (0.5), B (0.5).
- Row **B**: Columns A (0.5), D (0.5), F (0.5), G (0.25).
- Row **C**: Columns B (0.5), D (0.5), E (0.25), F (0.25), G (0.25).
- **0.25s**:
- Row **E**: Columns A (0.25), B (0.25).
- Row **D**: Columns C (0.25), E (0.25), F (0.25), G (0.25).
- Row **C**: Columns C (0.25), E (0.25), F (0.25), G (0.25).
- **Zeros**:
- Rows **J**, **H**, and parts of **A**, **B**, **D**, **E**, **F**, **G**, **I**.
### Key Observations
1. **Outlier**: The value **0.88** in **F-D** is the highest, significantly exceeding other values.
2. **Row I Dominance**: Row **I** has the most non-zero values (4 cells: B, C, D, G), with two 0.75s.
3. **Sparse Distribution**: Many cells (e.g., **J**, **H**, **A-D**, **A-E**) contain zeros, suggesting sparse data or absence of relationships.
4. **Diagonal Patterns**: Some diagonal clusters (e.g., **B-A**, **G-B**, **F-D**) show moderate values.
### Interpretation
This heatmap likely represents a **correlation matrix**, **probability distribution**, or **co-occurrence table**.
- **Row I** and **Column D** are central to high-value interactions, suggesting a strong relationship or dependency.
- The **0.88 in F-D** may indicate a critical or anomalous data point requiring further investigation.
- The **sparse zeros** imply that most row-column pairs have no interaction or negligible values.
- The **cluster of 0.75s in Row I** and **0.5s in Row G** could reflect hierarchical or grouped relationships.
### Spatial Grounding
- **Legend**: Absent; color coding inferred from value magnitude.
- **Axis Labels**: Rows (A-J) on the left, columns (A-G) on the top.
- **Data Placement**: Values are centered in cells, with darker colors for higher values.
### Trend Verification
- **Row I**: Peaks at 0.75 (columns C, D) and 0.5 (columns B, G).
- **Row F**: Peaks at 0.88 (column D) and 0.75 (column E).
- **Row G**: Consistent 0.5s in columns A and B.
- **Row E**: Low values (0.25) in columns A and B.
### Component Isolation
- **Header**: Row labels (A-J) and column labels (A-G).
- **Main Chart**: Grid of values with color gradients.
- **Footer**: No additional elements.
### Final Notes
The absence of a legend limits precise interpretation of color coding, but the pattern suggests a focus on **Row I** and **Column D** as key nodes. The **0.88 outlier** and **sparse zeros** highlight potential areas for deeper analysis.