## Chart/Diagram Type: Comparative Analysis of Embodied Video Models
### Overview
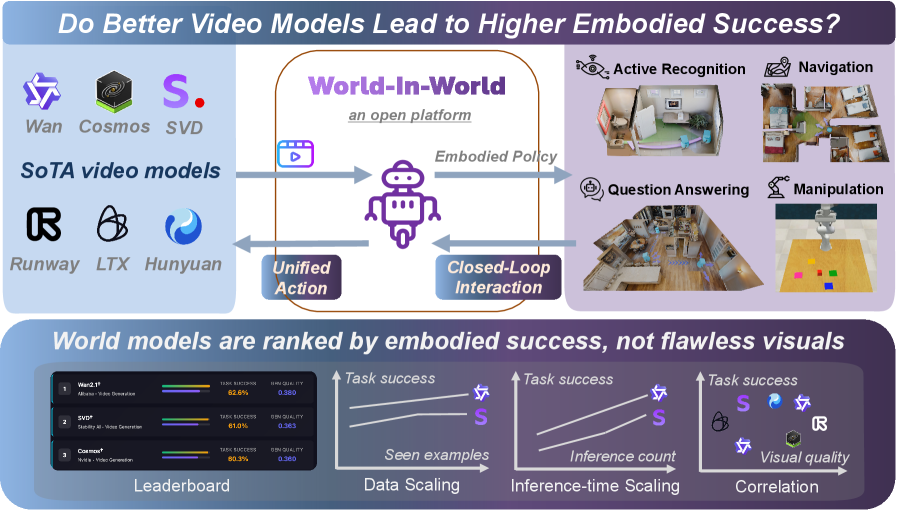
The image presents a comparative analysis of embodied video models and their performance in world-in-world tasks. It combines a leaderboard ranking models by embodied success metrics with a conceptual diagram illustrating how these models contribute to closed-loop interaction and unified action. The central theme explores whether improved video models correlate with higher embodied task success.
### Components/Axes
1. **Leaderboard Section**:
- **Categories**: Task Success, Data Scaling, Inference-time Scaling, Correlation
- **Models**: World-2.0, SVD*, Cosmos*
- **Metrics**:
- Task Success (%),
- Data Scaling (0-1 scale),
- Inference-time Scaling (%),
- Correlation (0-1 scale)
2. **Main Diagram**:
- **Central Element**: Purple robot labeled "Embodied Policy"
- **Arrows**:
- Left: "Unified Action" (blue)
- Right: "Closed-Loop Interaction" (purple)
- **Task Labels**: Active Recognition, Navigation, Question Answering, Manipulation
- **Platform**: "World-In-World" (orange border)
3. **Legend**:
- **Colors**:
- World-2.0 (blue),
- SVD* (purple),
- Cosmos* (orange)
### Detailed Analysis
1. **Leaderboard Data**:
- **World-2.0**:
- Task Success: 96.2% (highest)
- Data Scaling: 0.880 (highest)
- Inference-time Scaling: 0.800 (highest)
- Correlation: 0.800 (highest)
- **SVD***:
- Task Success: 83.1%
- Data Scaling: 0.830
- Inference-time Scaling: 0.750
- Correlation: 0.750
- **Cosmos***:
- Task Success: 80.5%
- Data Scaling: 0.800
- Inference-time Scaling: 0.700
- Correlation: 0.700
2. **Main Diagram**:
- **Flow**:
- Video models (Wan, Cosmos, SVD, Runway, LTX, Hunyuan) feed into the "World-In-World" platform
- Outputs connect to "Embodied Policy" with arrows indicating contributions to:
- Unified Action (left)
- Closed-Loop Interaction (right)
- **Task Representation**:
- Top row: Active Recognition, Navigation
- Bottom row: Question Answering, Manipulation
### Key Observations
1. **Performance Trends**:
- World-2.0 dominates across all metrics, maintaining a consistent lead
- SVD* and Cosmos* show similar performance patterns, with SVD* slightly outperforming in inference-time scaling
- All models show strong correlation scores (>0.7), suggesting good alignment with task requirements
2. **Visual Quality vs. Task Success**:
- The bottom section explicitly states "World models are ranked by embodied success, not flawless visuals"
- Correlation metrics (0.7-0.8) indicate moderate to strong relationship between visual quality and task success
3. **Scaling Patterns**:
- Data Scaling values (0.7-0.88) suggest models maintain effectiveness across different data volumes
- Inference-time Scaling (0.7-0.8) indicates consistent performance under time constraints
### Interpretation
The data demonstrates a clear hierarchy in embodied task performance, with World-2.0 establishing itself as the leading model. The consistent performance across all metrics suggests this model effectively balances visual quality with practical task execution capabilities. The "World-In-World" platform appears designed to test models in realistic scenarios, with the robot's bidirectional arrows indicating the importance of both unified action and closed-loop interaction for successful embodiment.
The emphasis on "embodied success" over visual perfection aligns with real-world robotics applications where functional performance matters more than aesthetic quality. The moderate correlation scores (0.7-0.8) suggest that while visual quality contributes to task success, it's not the sole determining factor - other elements like motion prediction and environmental understanding play crucial roles.
The platform's design implies a feedback loop where video models inform embodied policies, which in turn refine the models through closed-loop interaction. This circular relationship highlights the importance of continuous learning and adaptation in embodied AI systems.