## Diagram: Video Models and Embodied Success
### Overview
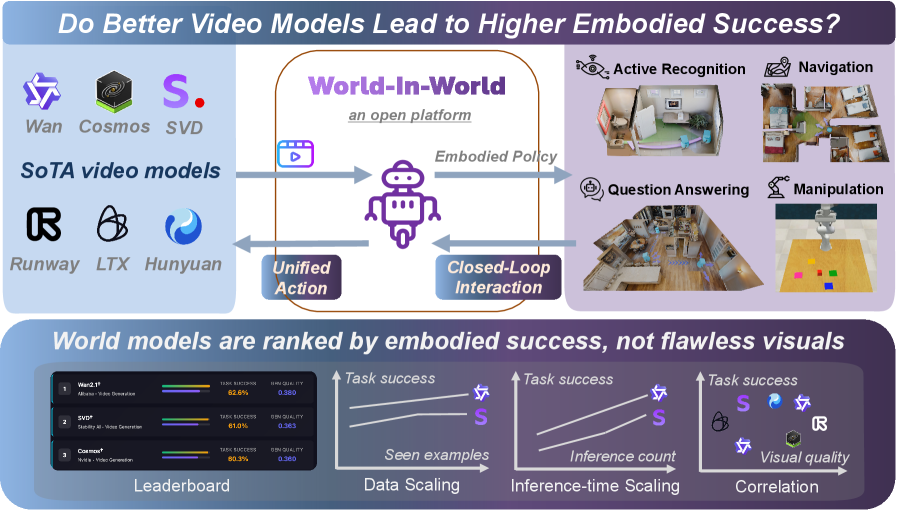
The image presents a diagram exploring the relationship between video models and embodied success. It outlines a system called "World-In-World," an open platform, and examines how different video models perform in various tasks. The diagram includes a leaderboard ranking models by embodied success, not visual fidelity, and correlation plots showing the relationship between task success and factors like seen examples, inference count, and visual quality.
### Components/Axes
* **Title:** "Do Better Video Models Lead to Higher Embodied Success?"
* **Central System:** "World-In-World" - described as "an open platform."
* **Embodied Policy:** A central component connecting "Unified Action" and "Closed-Loop Interaction."
* **SoTA video models:**
* Wan
* Cosmos
* SVD
* Runway
* LTX
* Hunyuan
* **Tasks:**
* Active Recognition (image of a room)
* Navigation (image of a floor plan)
* Question Answering (image of a kitchen)
* Manipulation (image of a robot arm manipulating colored blocks)
* **Leaderboard:** Ranks world models by embodied success.
* Columns: Rank, Model Name, Task Success, OSN Quality
* **Correlation Plots:** Three plots showing the relationship between Task Success and:
* Seen examples (Data Scaling)
* Inference count (Inference-time Scaling)
* Visual quality (Correlation)
### Detailed Analysis
**1. World-In-World System:**
* The diagram illustrates a flow where video models (SoTA video models) contribute to "Unified Action."
* "Unified Action" and "Closed-Loop Interaction" are connected via "Embodied Policy."
* The system supports tasks like Active Recognition, Navigation, Question Answering, and Manipulation.
**2. Leaderboard:**
The leaderboard ranks three video models based on "Task Success" and "OSN Quality."
| Rank | Model Name | Task Success | OSN Quality |
|------|------------------------------|--------------|-------------|
| 1 | Wan2.1 Alladin-Video Generation | 62.6% | 0.380 |
| 2 | SVD Stability AI - Video Generation | 61.0% | 0.363 |
| 3 | Cosmos Nvidia - Video Generation | 80.3% | 0.360 |
**3. Correlation Plots:**
* **Data Scaling (Seen examples):**
* The plot shows "Task success" vs. "Seen examples."
* The Wan model (represented by its logo) has a higher task success than the SVD model (represented by the letter "S"). Both show a positive correlation.
* **Inference-time Scaling (Inference count):**
* The plot shows "Task success" vs. "Inference count."
* The Wan model has a higher task success than the SVD model. Both show a positive correlation.
* **Correlation (Visual quality):**
* The plot shows "Task success" vs. "Visual quality."
* The plot shows the Wan model, SVD model, Cosmos model, Runway model, and LTX model.
* There is no clear linear correlation visible.
### Key Observations
* The "World-In-World" system aims to evaluate video models based on their embodied success in various tasks.
* The leaderboard emphasizes that the ranking is based on embodied success, not visual quality.
* The correlation plots suggest a positive relationship between task success and both "Seen examples" and "Inference count."
* The correlation between "Task success" and "Visual quality" is less clear.
### Interpretation
The diagram suggests that embodied success, as measured by performance in tasks like active recognition, navigation, question answering, and manipulation, is a key metric for evaluating video models. The "World-In-World" platform provides a framework for assessing these models. The positive correlation between task success and "Seen examples" and "Inference count" indicates that models benefit from more data and longer inference times. The lack of a clear correlation between task success and visual quality challenges the assumption that visually impressive models are necessarily more successful in embodied tasks. This implies that other factors, such as the model's ability to understand and interact with the environment, are more critical for embodied success. The leaderboard highlights specific models that perform well in this context, providing a benchmark for future research and development.