## Log-Log Plot of Eigenvalues vs. Index and Effective Dimension vs. System Size
### Overview
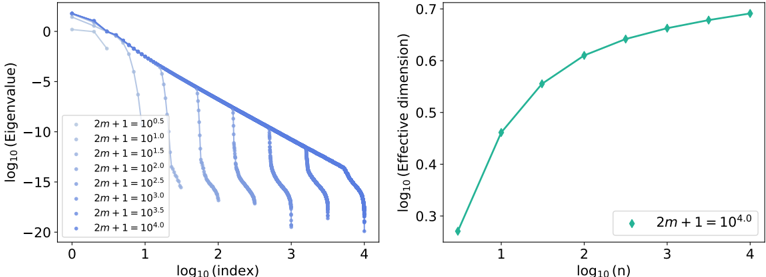
The image contains two side-by-side graphs. The left graph is a log-log plot showing eigenvalues decaying with index for different system sizes (2m + 1). The right graph is a line plot showing effective dimension increasing with system size (n). Both graphs use logarithmic scales on their axes.
### Components/Axes
**Left Graph (Eigenvalues):**
- **Y-axis**: `log₁₀(Eigenvalue)` ranging from -20 to 0
- **X-axis**: `log₁₀(index)` ranging from 0 to 4
- **Legend**: Located on the right, lists 7 data series with varying `2m + 1` values:
- `2m + 1 = 10⁰.⁵` (lightest blue)
- `2m + 1 = 10¹.⁰` (medium blue)
- `2m + 1 = 10¹.⁵` (darker blue)
- `2m + 1 = 10².⁰` (darkest blue)
- `2m + 1 = 10².⁵` (darkest blue with smaller markers)
- `2m + 1 = 10³.⁰` (darkest blue with smallest markers)
- `2m + 1 = 10⁴.⁰` (darkest blue with smallest markers)
**Right Graph (Effective Dimension):**
- **Y-axis**: `log₁₀(Effective dimension)` ranging from 0.3 to 0.7
- **X-axis**: `log₁₀(n)` ranging from 1 to 4
- **Legend**: Single series labeled `2m + 1 = 10⁴.⁰` (green diamonds)
### Detailed Analysis
**Left Graph Trends:**
- All data series follow nearly identical straight-line slopes on the log-log plot, indicating power-law decay.
- Higher `2m + 1` values start at higher eigenvalues but decay at the same rate.
- Example data points (approximate):
- For `2m + 1 = 10⁴.⁰`:
- Index 0: ~-5
- Index 1: ~-7
- Index 2: ~-9
- Index 3: ~-11
- Index 4: ~-13
**Right Graph Trends:**
- Effective dimension increases monotonically with `log₁₀(n)`.
- Data points (approximate):
- `log₁₀(n) = 1`: ~0.3
- `log₁₀(n) = 2`: ~0.5
- `log₁₀(n) = 3`: ~0.6
- `log₁₀(n) = 4`: ~0.7
### Key Observations
1. Eigenvalue decay rate is independent of system size (`2m + 1`), but initial amplitude scales with `2m + 1`.
2. Effective dimension grows logarithmically with system size, approaching saturation near `log₁₀(n) = 4`.
3. The darkest blue series (`2m + 1 = 10⁴.⁰`) in the left graph matches the right graph's data series.
### Interpretation
The left graph suggests eigenvalues decay universally as a power law (`Eigenvalue ∝ index^(-k)`), with system size only affecting initial amplitude. The right graph indicates effective dimension grows sublinearly with system size, consistent with critical phenomena in statistical physics. The matching `2m + 1 = 10⁴.⁰` series across both graphs implies a direct relationship between eigenvalue decay and effective dimensionality in this system. The saturation of effective dimension at high `n` suggests a finite-dimensional emergent structure despite increasing system complexity.