\n
## Line Chart: Inference Accuracy vs. Training Epochs
### Overview
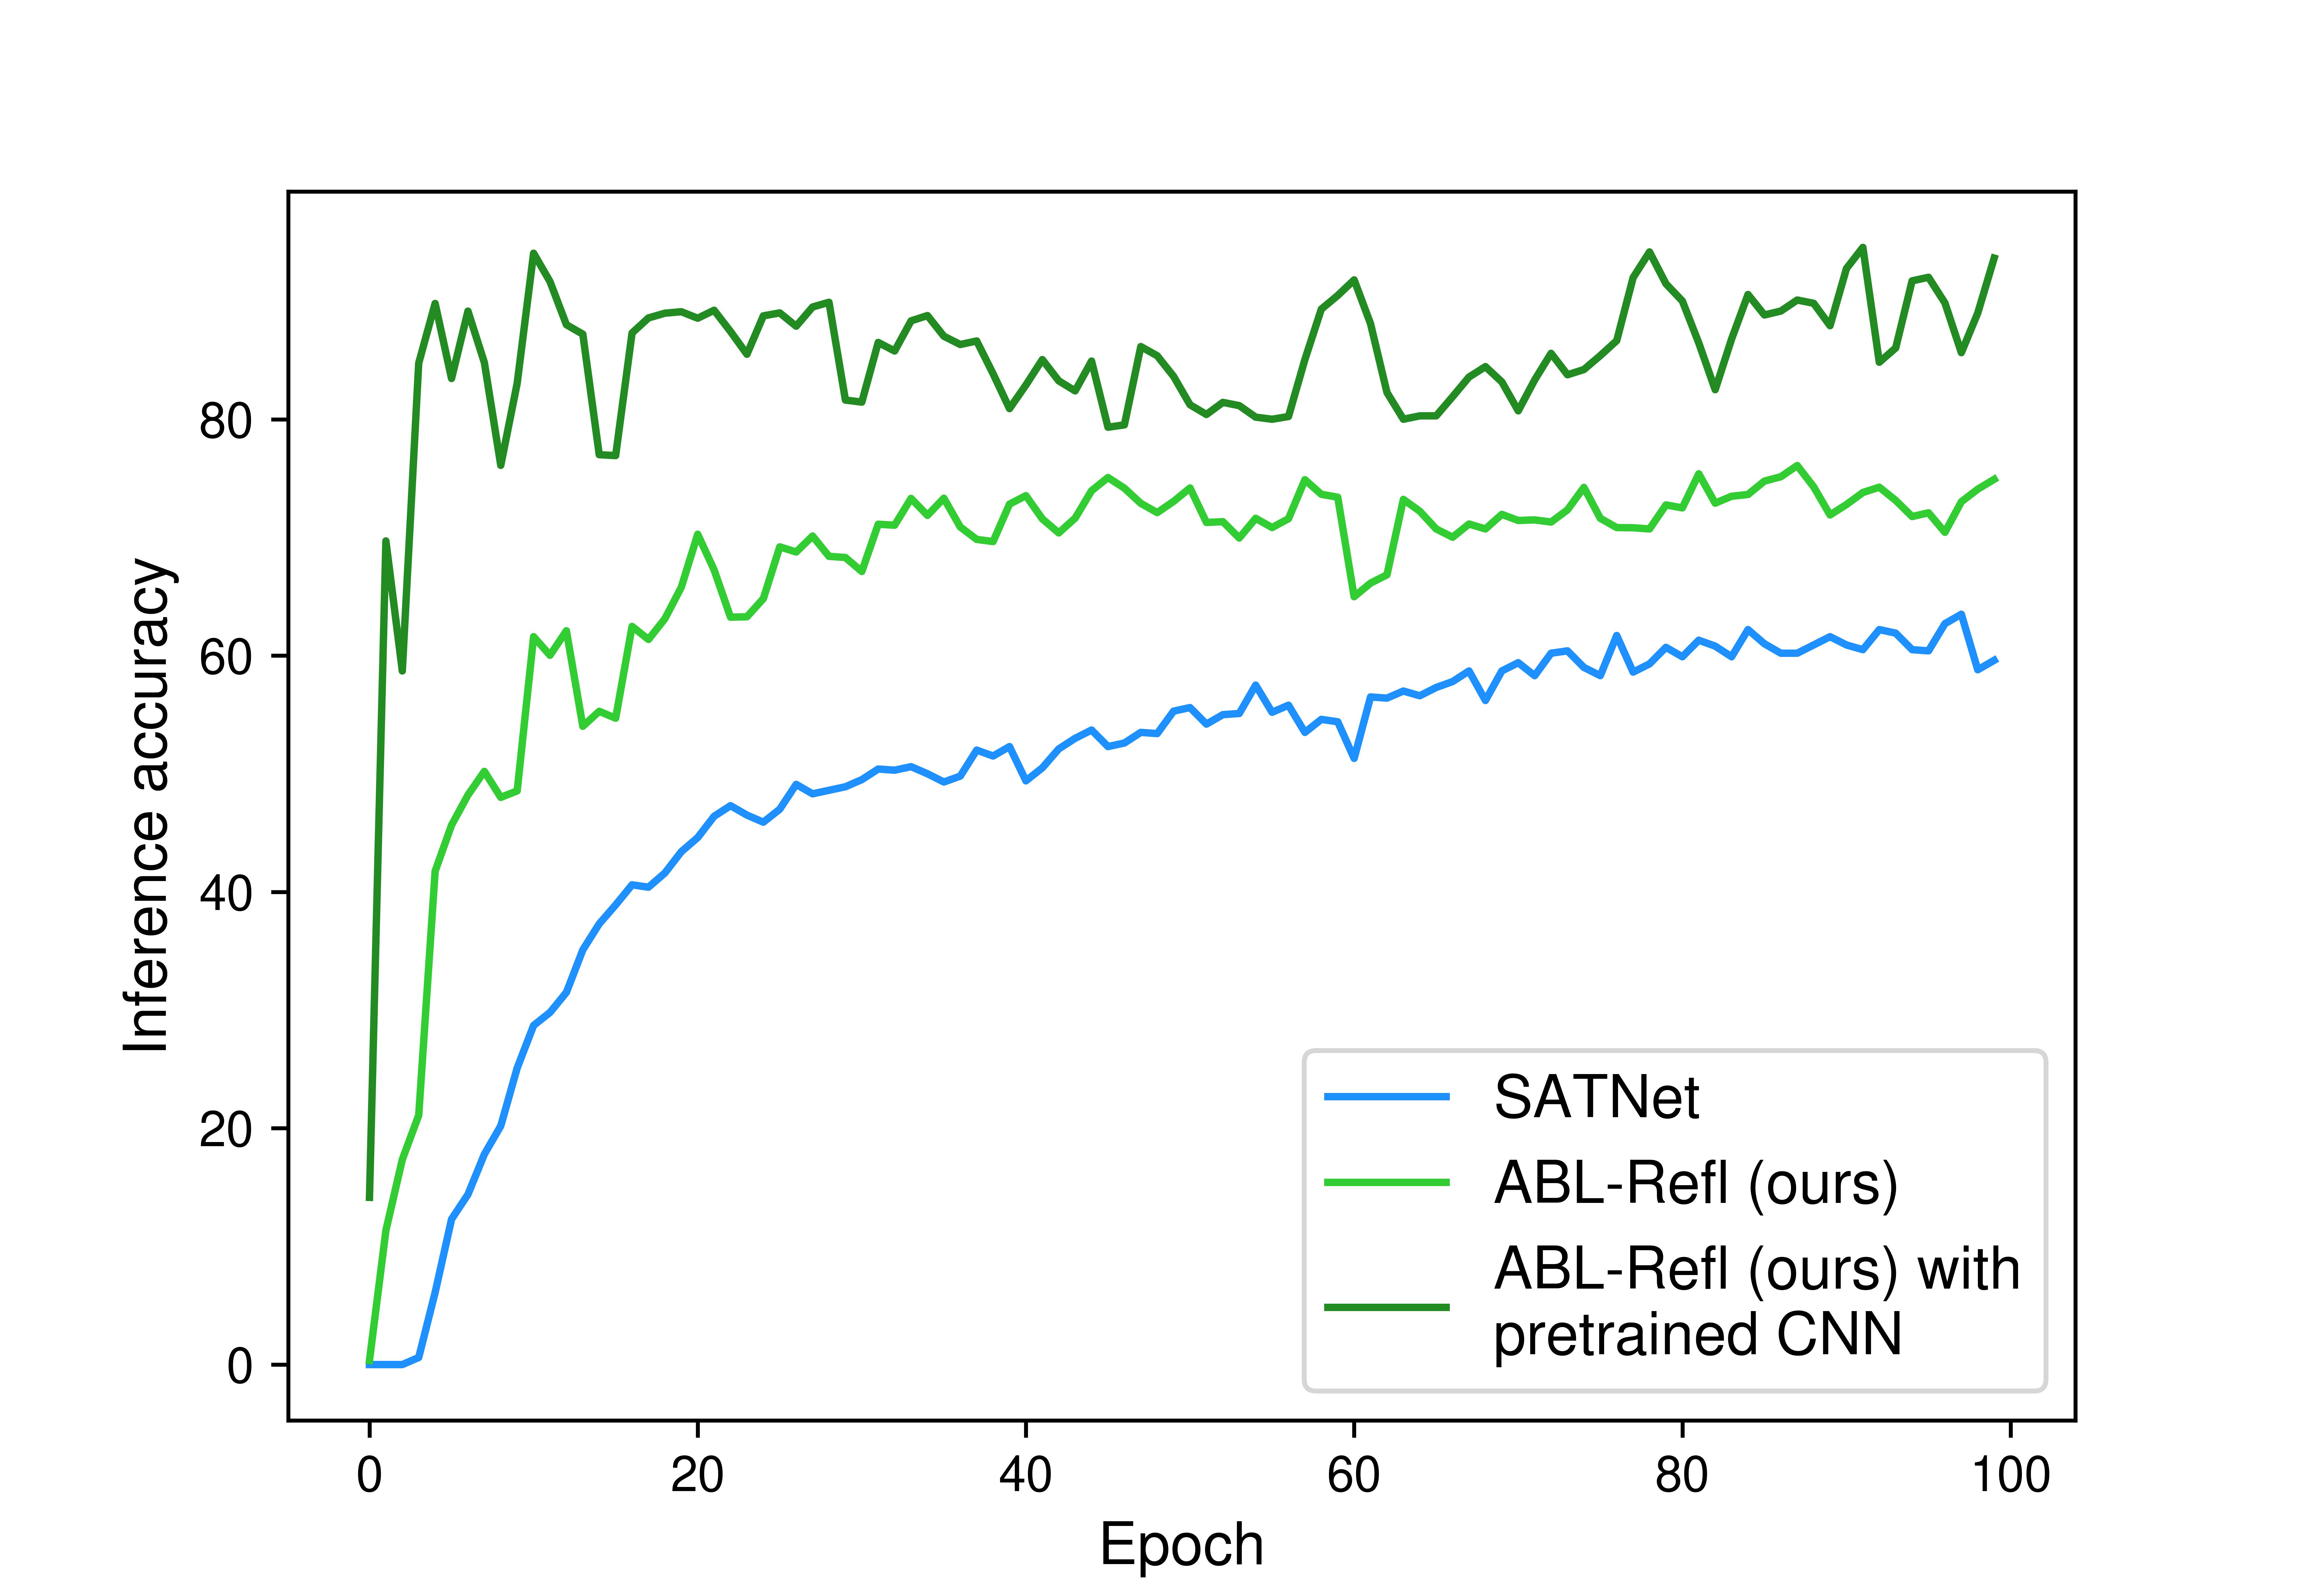
This image is a line chart comparing the training performance of three different machine learning models over 100 epochs. The chart plots "Inference accuracy" on the vertical axis against "Epoch" on the horizontal axis. The primary purpose is to demonstrate the learning curves and final performance of a proposed method ("ABL-Refl") against a baseline ("SATNet") and an enhanced version of the proposed method.
### Components/Axes
* **Chart Type:** Line chart with three data series.
* **X-Axis (Horizontal):**
* **Label:** "Epoch"
* **Scale:** Linear, from 0 to 100.
* **Major Tick Marks:** At intervals of 20 (0, 20, 40, 60, 80, 100).
* **Y-Axis (Vertical):**
* **Label:** "Inference accuracy"
* **Scale:** Linear, from 0 to approximately 95 (inferred from data peaks).
* **Major Tick Marks:** At intervals of 20 (0, 20, 40, 60, 80).
* **Legend:**
* **Position:** Bottom-right corner of the plot area.
* **Entries (from top to bottom):**
1. **SATNet:** Represented by a blue line.
2. **ABL-Refl (ours):** Represented by a light green line.
3. **ABL-Refl (ours) with pretrained CNN:** Represented by a dark green line.
### Detailed Analysis
The chart displays three distinct learning curves, each showing a general upward trend with varying degrees of volatility and final accuracy.
1. **SATNet (Blue Line):**
* **Trend:** Starts near 0% accuracy at epoch 0. Shows a steady, relatively smooth logarithmic growth curve. The rate of improvement slows after approximately epoch 40.
* **Approximate Data Points:**
* Epoch 0: ~0%
* Epoch 20: ~40%
* Epoch 40: ~50%
* Epoch 60: ~55%
* Epoch 80: ~60%
* Epoch 100: ~60% (ends slightly below its peak).
2. **ABL-Refl (ours) (Light Green Line):**
* **Trend:** Starts near 0% at epoch 0. Exhibits a rapid initial increase, followed by a more gradual climb with moderate fluctuations. It consistently outperforms SATNet after the first few epochs.
* **Approximate Data Points:**
* Epoch 0: ~0%
* Epoch 20: ~65%
* Epoch 40: ~70%
* Epoch 60: ~70% (with a notable dip around epoch 60).
* Epoch 80: ~72%
* Epoch 100: ~75%.
3. **ABL-Refl (ours) with pretrained CNN (Dark Green Line):**
* **Trend:** Starts at a significantly higher accuracy (~15%) at epoch 0. Shows an extremely rapid initial jump to over 80% within the first 5-10 epochs. After this initial surge, it enters a volatile plateau phase, oscillating between approximately 80% and 95% for the remainder of training. It is the top-performing model throughout.
* **Approximate Data Points:**
* Epoch 0: ~15%
* Epoch 10: Peaks near ~95%.
* Epoch 20: ~85%
* Epoch 40: ~82%
* Epoch 60: ~90% (after a local peak).
* Epoch 80: ~85%
* Epoch 100: ~92%.
### Key Observations
* **Performance Hierarchy:** A clear and consistent performance order is established early and maintained: "ABL-Refl with pretrained CNN" > "ABL-Refl" > "SATNet".
* **Impact of Pretraining:** The addition of a pretrained CNN provides a massive initial boost (starting at ~15% vs. 0%) and leads to a much higher final accuracy ceiling (~90%+ vs. ~75%).
* **Convergence & Stability:**
* SATNet shows the most stable, predictable convergence.
* ABL-Refl shows moderate volatility.
* ABL-Refl with pretrained CNN exhibits high volatility after its initial rapid learning, suggesting the model may be sensitive to batch variations or is operating in a regime where small changes lead to significant accuracy swings.
* **Learning Speed:** The two ABL-Refl variants learn much faster in the initial epochs compared to SATNet.
### Interpretation
This chart provides strong evidence for the effectiveness of the proposed "ABL-Refl" method over the "SATNet" baseline. The data suggests two key findings:
1. **Methodological Superiority:** The core ABL-Refl architecture (light green) achieves a ~15 percentage point higher final accuracy than SATNet, indicating a more effective learning mechanism for the given task.
2. **Value of Pretraining:** Integrating a pretrained CNN (dark green) is not merely an incremental improvement but a transformative one. It drastically reduces the "cold start" problem (beginning with non-zero accuracy) and unlocks a significantly higher performance potential. However, this comes at the cost of training stability, as seen in the high-variance plateau.
The volatility in the top-performing model's curve is a notable anomaly. It could indicate that the model is teetering on the edge of overfitting, that the learning rate is too high for the fine-tuning phase, or that the task has inherent noise that becomes more apparent at high accuracy levels. From a practical standpoint, one might consider implementing early stopping or a learning rate scheduler to capture the model at one of its peak performance points (e.g., near epoch 10 or 70) rather than at the final epoch. The chart effectively argues that ABL-Refl is a superior approach, and that pairing it with pretrained features is essential for achieving state-of-the-art results on this specific inference task.