## Line Chart: Performance Benchmark of Token Processing Implementations
### Overview
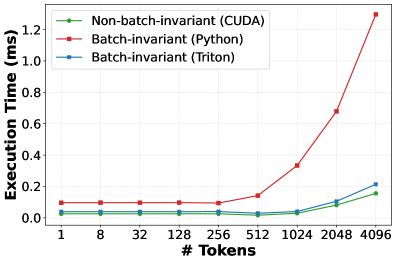
This image displays a line chart comparing the execution time (in milliseconds) of three different software implementations across varying numbers of tokens. The chart demonstrates how performance scales as the input size (# Tokens) increases from 1 to 4096.
### Components/Axes
* **Y-Axis:** "Execution Time (ms)". The scale ranges from 0.0 to 1.2, with increments of 0.2.
* **X-Axis:** "# Tokens". The scale is logarithmic, with markers at: 1, 8, 32, 128, 256, 512, 1024, 2048, 4096.
* **Legend (Positioned Top-Left):**
* **Green line with circle markers:** "Non-batch-invariant (CUDA)"
* **Red line with square markers:** "Batch-invariant (Python)"
* **Blue line with square markers:** "Batch-invariant (Triton)"
### Detailed Analysis
#### Trend Verification
* **Non-batch-invariant (CUDA) [Green]:** This line represents the most efficient implementation. It remains relatively flat and low between 1 and 512 tokens, then begins a gradual upward slope, showing the lowest execution time across the entire range.
* **Batch-invariant (Triton) [Blue]:** This line follows a nearly identical trajectory to the CUDA implementation. It remains very low and stable until 512 tokens, then begins to rise, ending slightly higher than the CUDA implementation at 4096 tokens.
* **Batch-invariant (Python) [Red]:** This line starts significantly higher than the other two. It remains relatively flat until 256 tokens, then exhibits a sharp, exponential increase in execution time starting at 512 tokens, diverging drastically from the other two implementations.
#### Data Points (Approximate Values)
| # Tokens | Non-batch-invariant (CUDA) | Batch-invariant (Triton) | Batch-invariant (Python) |
| :--- | :--- | :--- | :--- |
| **1** | ~0.03 ms | ~0.04 ms | ~0.10 ms |
| **8** | ~0.03 ms | ~0.04 ms | ~0.10 ms |
| **32** | ~0.03 ms | ~0.04 ms | ~0.10 ms |
| **128** | ~0.03 ms | ~0.04 ms | ~0.10 ms |
| **256** | ~0.03 ms | ~0.04 ms | ~0.10 ms |
| **512** | ~0.02 ms | ~0.03 ms | ~0.15 ms |
| **1024** | ~0.03 ms | ~0.04 ms | ~0.35 ms |
| **2048** | ~0.08 ms | ~0.10 ms | ~0.68 ms |
| **4096** | ~0.15 ms | ~0.20 ms | ~1.30 ms |
### Key Observations
* **Performance Gap:** There is a massive performance disparity between the Python implementation and the GPU-accelerated implementations (CUDA and Triton) as the token count increases. At 4096 tokens, the Python implementation is roughly 6.5x slower than the Triton implementation and nearly 9x slower than the CUDA implementation.
* **The "Knee" Point:** All three implementations show a slight dip in execution time at 512 tokens before the upward trend begins. This may indicate a cache behavior or a specific optimization threshold in the underlying hardware/software execution.
* **Triton vs. CUDA:** The Triton implementation is highly competitive with the raw CUDA implementation, suggesting that Triton provides a near-native performance experience for this specific "batch-invariant" operation.
### Interpretation
The data demonstrates the critical importance of implementation choice when handling high-throughput token processing.
1. **Python Bottleneck:** The "Batch-invariant (Python)" implementation is clearly not suitable for high-token-count workloads. The exponential growth suggests that the Python overhead becomes the dominant factor as the workload scales, likely due to interpreter overhead or lack of efficient parallelization compared to the GPU-based approaches.
2. **Triton as a Solution:** The fact that "Batch-invariant (Triton)" tracks so closely with "Non-batch-invariant (CUDA)" is significant. It suggests that developers can achieve near-CUDA performance using Triton, which is generally easier to write and maintain than raw CUDA kernels.
3. **Scalability:** For applications requiring processing of 1024+ tokens, moving away from a standard Python implementation to a compiled/GPU-accelerated implementation (like Triton) is essential to prevent performance degradation.