## Stacked Bar Chart: Agentbench vs. SAGE Performance
### Overview
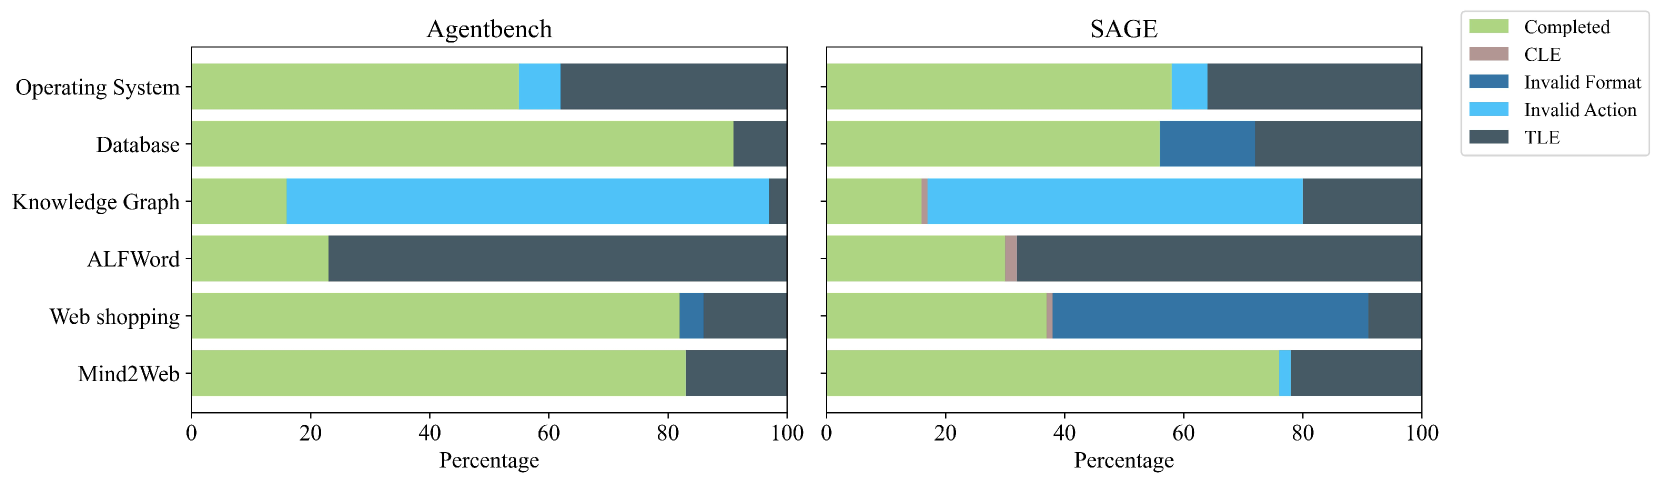
The image presents a pair of stacked horizontal bar charts comparing the performance of two systems, "Agentbench" and "SAGE," across six different tasks: Operating System, Database, Knowledge Graph, ALFWord, Web shopping, and Mind2Web. The charts display the percentage of outcomes categorized as "Completed," "CLE," "Invalid Format," "Invalid Action," and "TLE" (Time Limit Exceeded).
### Components/Axes
* **Titles:** "Agentbench" (left chart), "SAGE" (right chart)
* **Y-axis Labels:** Operating System, Database, Knowledge Graph, ALFWord, Web shopping, Mind2Web (listed vertically on the left of each chart)
* **X-axis Label:** Percentage (horizontal axis, ranging from 0 to 100 in increments of 20)
* **Legend:** Located in the top-right corner, mapping colors to categories:
* Light Green: Completed
* Gray: CLE
* Dark Blue: Invalid Format
* Light Blue: Invalid Action
* Dark Gray: TLE
### Detailed Analysis
**Agentbench (Left Chart):**
* **Operating System:** Approximately 70% Completed, 10% Invalid Action, 20% TLE.
* **Database:** Approximately 80% Completed, 20% TLE.
* **Knowledge Graph:** Approximately 60% Completed, 40% Invalid Action.
* **ALFWord:** Approximately 20% Completed, 80% TLE.
* **Web shopping:** Approximately 75% Completed, 5% Invalid Format, 20% TLE.
* **Mind2Web:** Approximately 75% Completed, 25% TLE.
**SAGE (Right Chart):**
* **Operating System:** Approximately 20% Completed, 10% Invalid Format, 70% TLE.
* **Database:** Approximately 30% Completed, 20% Invalid Action, 50% TLE.
* **Knowledge Graph:** Approximately 10% Completed, 50% Invalid Action, 40% TLE.
* **ALFWord:** Approximately 5% CLE, 95% TLE.
* **Web shopping:** Approximately 60% Completed, 10% Invalid Format, 30% TLE.
* **Mind2Web:** Approximately 70% Completed, 10% Invalid Format, 20% TLE.
### Key Observations
* **Agentbench** generally shows a higher percentage of "Completed" tasks compared to **SAGE**.
* **SAGE** exhibits a significantly higher percentage of "TLE" (Time Limit Exceeded) outcomes across most tasks.
* The "Knowledge Graph" task shows a high percentage of "Invalid Action" for both systems, but especially for SAGE.
* "ALFWord" is overwhelmingly dominated by "TLE" for SAGE.
### Interpretation
The data suggests that Agentbench is generally more efficient and successful in completing the given tasks within the allotted time compared to SAGE. SAGE struggles with time limits, especially on the "ALFWord" task. Both systems encounter issues with "Invalid Action" on the "Knowledge Graph" task, indicating a potential problem with how they handle or interpret the knowledge graph data. The "Invalid Format" errors are relatively low for Agentbench, but present in some tasks for SAGE, suggesting potential data formatting issues or compatibility problems for SAGE. Overall, Agentbench appears to be the more robust and reliable system based on these performance metrics.