\n
## Stacked Bar Chart: Agentbench vs. SAGE Performance
### Overview
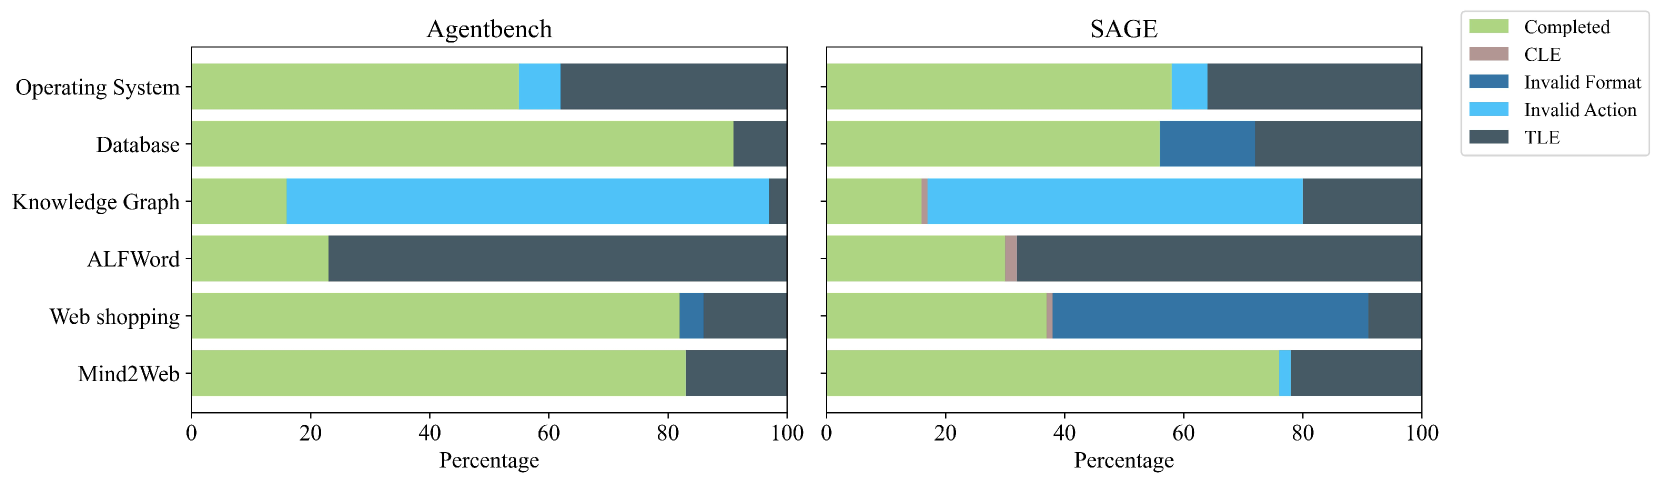
The image presents a stacked bar chart comparing the performance of two agents, "Agentbench" and "SAGE", across six different tasks: Operating System, Database, Knowledge Graph, ALFWord, Web shopping, and MultiWeb. The performance is categorized into four outcomes: Completed, CLE (likely Constraint Logic Expression), Invalid Format, Invalid Action, and TLE (Time Limit Exceeded). The x-axis represents the percentage of tasks, ranging from 0 to 100.
### Components/Axes
* **X-axis:** Percentage (0 to 100)
* **Y-axis:** Task Name (Operating System, Database, Knowledge Graph, ALFWord, Web shopping, MultiWeb)
* **Legend (Top-Right):**
* Completed (Light Green)
* CLE (Green)
* Invalid Format (Light Blue)
* Invalid Action (Dark Blue)
* TLE (Black)
* **Chart 1 (Left):** Agentbench
* **Chart 2 (Right):** SAGE
### Detailed Analysis
**Agentbench:**
* **Operating System:** Approximately 95% TLE, 5% Completed.
* **Database:** Approximately 85% CLE, 10% TLE, 5% Completed.
* **Knowledge Graph:** Approximately 60% CLE, 30% Invalid Format, 10% Completed.
* **ALFWord:** Approximately 70% CLE, 20% Invalid Format, 10% Completed.
* **Web shopping:** Approximately 75% CLE, 15% Invalid Format, 10% Completed.
* **MultiWeb:** Approximately 80% CLE, 10% Invalid Format, 5% TLE, 5% Completed.
**SAGE:**
* **Operating System:** Approximately 90% Completed, 10% TLE.
* **Database:** Approximately 70% Completed, 20% CLE, 10% Invalid Action.
* **Knowledge Graph:** Approximately 60% Completed, 30% CLE, 10% Invalid Format.
* **ALFWord:** Approximately 70% Completed, 20% CLE, 10% Invalid Format.
* **Web shopping:** Approximately 80% Completed, 10% CLE, 10% Invalid Format.
* **MultiWeb:** Approximately 70% Completed, 20% CLE, 10% Invalid Format.
### Key Observations
* **TLE Dominance in Agentbench:** Agentbench struggles significantly with the Operating System task, with nearly all attempts resulting in a TLE.
* **CLE Dominance in Agentbench (other tasks):** For most tasks other than Operating System, Agentbench primarily results in CLE outcomes.
* **SAGE's Higher Completion Rate:** SAGE consistently achieves a much higher completion rate across all tasks compared to Agentbench.
* **SAGE's More Balanced Outcomes:** SAGE's outcomes are more evenly distributed across Completed, CLE, and Invalid Format/Action categories.
* **Invalid Format/Action are rare in Agentbench:** Agentbench rarely results in Invalid Format or Invalid Action outcomes.
### Interpretation
The data strongly suggests that SAGE is significantly more capable than Agentbench in handling the tested tasks. SAGE demonstrates a higher ability to complete tasks successfully, while Agentbench frequently encounters time limits (TLE) or produces results that are classified as CLE. The CLE outcome for Agentbench suggests that the agent is generating logically valid expressions but may not be fully satisfying the task requirements. The higher completion rate of SAGE indicates a more robust and effective agent design. The difference in performance is particularly striking for the Operating System task, where Agentbench almost exclusively times out. This could indicate that SAGE has specific optimizations or a different approach to handling this type of task. The relatively low occurrence of "Invalid Format" and "Invalid Action" for Agentbench suggests that it generally produces syntactically correct outputs, even if they are not always logically complete or correct. The consistent presence of CLE outcomes suggests a potential area for improvement in Agentbench's reasoning or task understanding capabilities.