## Bar Chart: Agentbench vs SAGE Performance by Task
### Overview
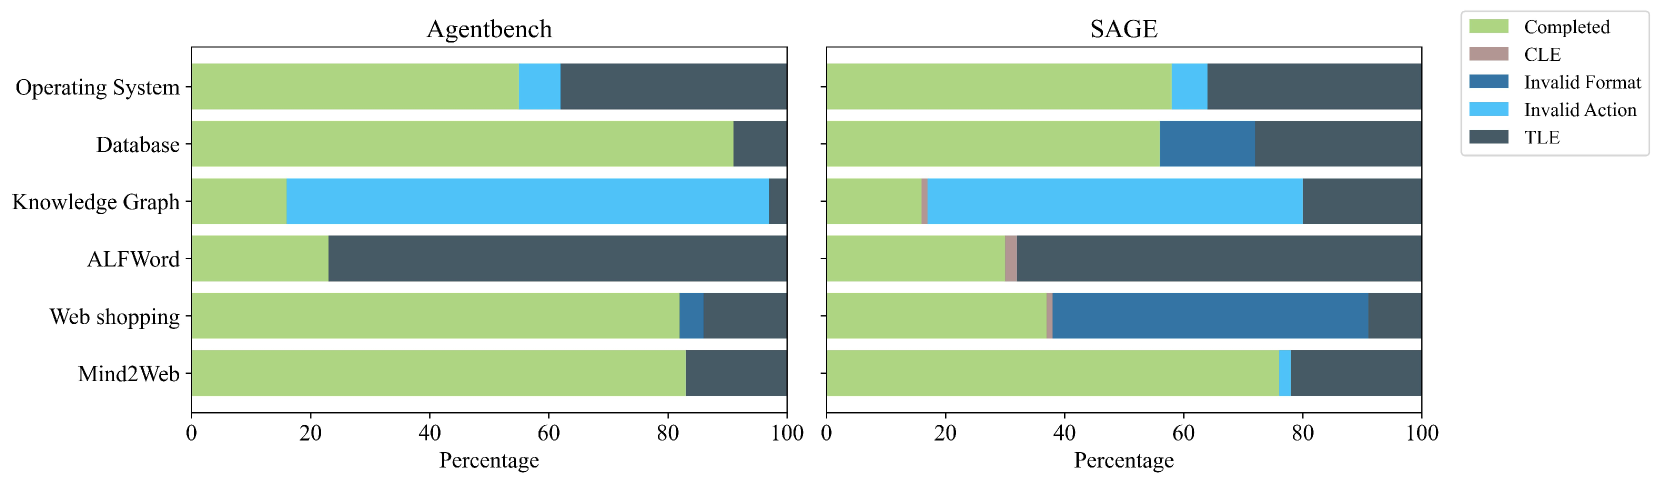
The image presents a comparative bar chart analyzing task performance across two datasets: Agentbench (left) and SAGE (right). Each dataset contains six horizontal bars representing different task categories, with color-coded segments indicating completion statuses. The chart uses a percentage scale (0-100) on the x-axis and task categories on the y-axis.
### Components/Axes
- **Legend**: Located in the top-right corner, with five color-coded statuses:
- Green: Completed
- Brown: CLE (Critical Logic Error)
- Dark Blue: Invalid Format
- Light Blue: Invalid Action
- Dark Gray: TLE (Time Limit Exceeded)
- **X-axis**: Labeled "Percentage" with a scale from 0 to 100.
- **Y-axis**: Six task categories:
1. Operating System
2. Database
3. Knowledge Graph
4. ALFWord
5. Web shopping
6. Mind2Web
### Detailed Analysis
#### Agentbench (Left)
1. **Operating System**:
- Completed (green): ~50%
- Invalid Action (light blue): ~10%
- TLE (dark gray): ~40%
- CLE/Invalid Format: Negligible
2. **Database**:
- Completed: ~85%
- TLE: ~10%
- Invalid Format: ~5%
3. **Knowledge Graph**:
- Invalid Action: ~90%
- Completed: ~10%
4. **ALFWord**:
- TLE: ~80%
- Completed: ~20%
5. **Web shopping**:
- Completed: ~70%
- Invalid Action: ~5%
- TLE: ~25%
6. **Mind2Web**:
- Completed: ~80%
- TLE: ~20%
#### SAGE (Right)
1. **Operating System**:
- Completed: ~60%
- TLE: ~30%
- Invalid Action: ~10%
2. **Database**:
- Completed: ~70%
- Invalid Format: ~15%
- TLE: ~15%
3. **Knowledge Graph**:
- Invalid Action: ~80%
- Completed: ~20%
4. **ALFWord**:
- TLE: ~70%
- Completed: ~30%
5. **Web shopping**:
- Invalid Format: ~85%
- Completed: ~40%
6. **Mind2Web**:
- Completed: ~75%
- TLE: ~20%
### Key Observations
1. **High TLE Rates**:
- ALFWord consistently shows the highest TLE rates (80% in Agentbench, 70% in SAGE).
2. **Invalid Action Dominance**:
- Knowledge Graph in Agentbench has 90% Invalid Action, while SAGE's Knowledge Graph shows 80%.
3. **Format Issues**:
- SAGE's Web shopping has 85% Invalid Format, the highest across all categories.
4. **Completion Rates**:
- Database tasks perform best in Agentbench (85% Completed), while SAGE's Database shows 70%.
### Interpretation
The data reveals significant task-specific challenges:
- **Knowledge Graph** struggles with action validity in both datasets, suggesting potential issues with query execution or reasoning logic.
- **ALFWord**'s high TLE rates indicate time-sensitive processing bottlenecks, possibly due to complex word embedding tasks.
- **Web shopping** in SAGE has extreme Invalid Format rates, pointing to data preprocessing or schema validation problems.
- **Database** tasks show better performance in Agentbench, implying possible optimizations in SAGE's implementation.
The color-coded segmentation highlights that no task achieves high completion rates without trade-offs in other statuses, suggesting systemic challenges in task execution across both datasets.