## Chart Type: Multiple Line Graphs Comparing Model Performance
### Overview
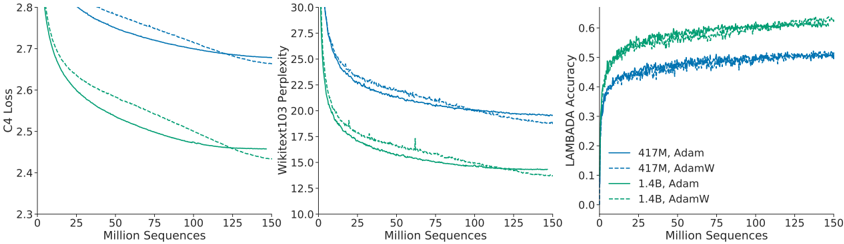
The image presents three line graphs comparing the performance of different language models using different optimization algorithms. The graphs depict C4 Loss, Wikitext103 Perplexity, and LAMBADA Accuracy as a function of training sequences (in millions). The models compared are 417M and 1.4B parameter models, each trained with both Adam and AdamW optimizers.
### Components/Axes
* **X-axis (all graphs):** "Million Sequences" - Ranges from 0 to 150, with tick marks at intervals of 25.
* **Left Graph:**
* **Y-axis:** "C4 Loss" - Ranges from 2.3 to 2.8, with tick marks at intervals of 0.1.
* **Middle Graph:**
* **Y-axis:** "Wikitext103 Perplexity" - Ranges from 10.0 to 30.0, with tick marks at intervals of 2.5.
* **Right Graph:**
* **Y-axis:** "LAMBADA Accuracy" - Ranges from 0.0 to 0.6, with tick marks at intervals of 0.1.
* **Legend (bottom-right):**
* Solid Blue: "417M, Adam"
* Dashed Blue: "417M, AdamW"
* Solid Green: "1.4B, Adam"
* Dashed Green: "1.4B, AdamW"
### Detailed Analysis
**Left Graph: C4 Loss**
* **417M, Adam (Solid Blue):** Starts at approximately 2.8, decreases to approximately 2.68 by 150 million sequences.
* **417M, AdamW (Dashed Blue):** Starts at approximately 2.78, decreases to approximately 2.67 by 150 million sequences.
* **1.4B, Adam (Solid Green):** Starts at approximately 2.7, decreases to approximately 2.46 by 150 million sequences.
* **1.4B, AdamW (Dashed Green):** Starts at approximately 2.65, decreases to approximately 2.45 by 150 million sequences.
**Middle Graph: Wikitext103 Perplexity**
* **417M, Adam (Solid Blue):** Starts at approximately 29.5, decreases to approximately 21 by 150 million sequences.
* **417M, AdamW (Dashed Blue):** Starts at approximately 27.5, decreases to approximately 20.5 by 150 million sequences.
* **1.4B, Adam (Solid Green):** Starts at approximately 25, decreases to approximately 15 by 150 million sequences.
* **1.4B, AdamW (Dashed Green):** Starts at approximately 23, decreases to approximately 14 by 150 million sequences.
**Right Graph: LAMBADA Accuracy**
* **417M, Adam (Solid Blue):** Starts at approximately 0.35, increases to approximately 0.47 by 150 million sequences.
* **417M, AdamW (Dashed Blue):** Starts at approximately 0.37, increases to approximately 0.48 by 150 million sequences.
* **1.4B, Adam (Solid Green):** Starts at approximately 0.42, increases to approximately 0.55 by 150 million sequences.
* **1.4B, AdamW (Dashed Green):** Starts at approximately 0.45, increases to approximately 0.57 by 150 million sequences.
### Key Observations
* In all three graphs, the 1.4B parameter models (green lines) outperform the 417M parameter models (blue lines).
* AdamW (dashed lines) generally performs slightly better than Adam (solid lines) for both model sizes, especially in terms of LAMBADA Accuracy.
* C4 Loss and Wikitext103 Perplexity decrease with more training sequences, while LAMBADA Accuracy increases.
* The most significant performance differences are observed in the Wikitext103 Perplexity graph.
### Interpretation
The data suggests that increasing model size (from 417M to 1.4B parameters) leads to better performance across all three metrics: lower loss, lower perplexity, and higher accuracy. Additionally, using the AdamW optimizer generally results in a slight improvement over the Adam optimizer for these language models. The trends indicate that continued training would likely further improve the performance of all models, although the rate of improvement may diminish over time. The Wikitext103 Perplexity metric appears to be the most sensitive to differences in model size and optimizer choice, making it a useful benchmark for comparing these models.