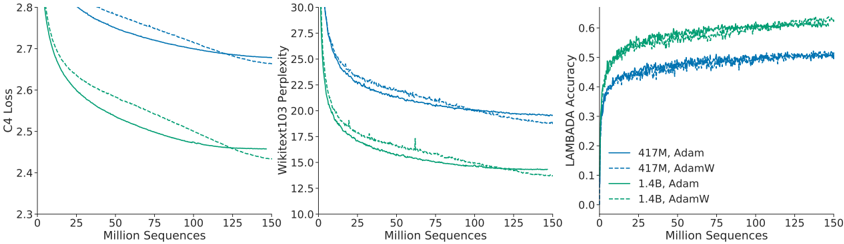
## Charts: Model Training Performance
### Overview
The image presents three charts displaying the training performance of different language models. The charts show the relationship between model training progress (measured in Million Sequences) and various performance metrics: C4 Loss, WikiText103 Perplexity, and LAMBADA Accuracy. Four different model configurations are compared: 417M with Adam optimizer, 417M with AdamW optimizer, 1.4B with Adam optimizer, and 1.4B with AdamW optimizer.
### Components/Axes
Each chart shares a common x-axis:
* **X-axis:** Million Sequences (ranging from 0 to 150)
The y-axes vary per chart:
* **Left Chart:** C4 Loss (ranging from 2.3 to 2.8)
* **Center Chart:** WikiText103 Perplexity (ranging from 10.0 to 30.0)
* **Right Chart:** LAMBADA Accuracy (ranging from 0.0 to 0.7)
The legend, located in the bottom-right corner, identifies the four model configurations using both size (417M, 1.4B) and optimizer (Adam, AdamW) and corresponding line colors:
* **Blue Solid Line:** 417M, Adam
* **Blue Dashed Line:** 417M, AdamW
* **Green Solid Line:** 1.4B, Adam
* **Green Dashed Line:** 1.4B, AdamW
### Detailed Analysis
**Left Chart: C4 Loss vs. Million Sequences**
* **417M, Adam (Blue Solid):** The line starts at approximately 2.78 at 0 Million Sequences and decreases to approximately 2.55 at 150 Million Sequences. The decrease is most rapid in the first 50 Million Sequences, then plateaus.
* **417M, AdamW (Blue Dashed):** The line starts at approximately 2.75 at 0 Million Sequences and decreases to approximately 2.52 at 150 Million Sequences. The decrease is similar to the Adam variant, but consistently lower.
* **1.4B, Adam (Green Solid):** The line starts at approximately 2.70 at 0 Million Sequences and decreases to approximately 2.40 at 150 Million Sequences. The decrease is more pronounced than the 417M models.
* **1.4B, AdamW (Green Dashed):** The line starts at approximately 2.65 at 0 Million Sequences and decreases to approximately 2.35 at 150 Million Sequences. This line consistently shows the lowest loss values.
**Center Chart: WikiText103 Perplexity vs. Million Sequences**
* **417M, Adam (Blue Solid):** The line starts at approximately 29.0 at 0 Million Sequences and decreases to approximately 22.0 at 150 Million Sequences.
* **417M, AdamW (Blue Dashed):** The line starts at approximately 28.5 at 0 Million Sequences and decreases to approximately 21.5 at 150 Million Sequences.
* **1.4B, Adam (Green Solid):** The line starts at approximately 27.0 at 0 Million Sequences and decreases to approximately 16.0 at 150 Million Sequences.
* **1.4B, AdamW (Green Dashed):** The line starts at approximately 26.0 at 0 Million Sequences and decreases to approximately 15.0 at 150 Million Sequences.
**Right Chart: LAMBADA Accuracy vs. Million Sequences**
* **417M, Adam (Blue Solid):** The line starts at approximately 0.35 at 0 Million Sequences and increases to approximately 0.52 at 150 Million Sequences.
* **417M, AdamW (Blue Dashed):** The line starts at approximately 0.38 at 0 Million Sequences and increases to approximately 0.55 at 150 Million Sequences.
* **1.4B, Adam (Green Solid):** The line starts at approximately 0.45 at 0 Million Sequences and increases to approximately 0.65 at 150 Million Sequences.
* **1.4B, AdamW (Green Dashed):** The line starts at approximately 0.48 at 0 Million Sequences and increases to approximately 0.68 at 150 Million Sequences.
### Key Observations
* **Model Size:** The 1.4B models consistently outperform the 417M models across all metrics.
* **Optimizer:** AdamW generally leads to better performance than Adam, as indicated by lower loss and perplexity, and higher accuracy.
* **Convergence:** All models show diminishing returns in performance as training progresses beyond 100 Million Sequences.
* **C4 Loss & Perplexity Correlation:** The C4 Loss and WikiText103 Perplexity charts exhibit an inverse relationship; as loss decreases, perplexity also decreases.
* **LAMBADA Accuracy & Training:** LAMBADA Accuracy increases with training, indicating the model's ability to learn long-range dependencies.
### Interpretation
These charts demonstrate the impact of model size and optimizer choice on language model training. The larger 1.4B models achieve significantly better performance than the 417M models, suggesting that increasing model capacity is beneficial. The use of the AdamW optimizer consistently improves performance over Adam, likely due to its weight decay regularization, which helps prevent overfitting.
The diminishing returns observed after 100 Million Sequences suggest that further training may not yield substantial improvements. The inverse relationship between C4 Loss and WikiText103 Perplexity indicates that reducing loss on the C4 dataset leads to better generalization performance on the WikiText103 dataset. The increasing LAMBADA Accuracy demonstrates the model's ability to capture long-range dependencies, which is crucial for tasks requiring contextual understanding.
The data suggests that a 1.4B model trained with the AdamW optimizer is the most effective configuration among those tested. The charts provide valuable insights into the training dynamics of language models and can inform decisions about model architecture and training strategies.