## Diagram: Reporter Agent Workflow
### Overview
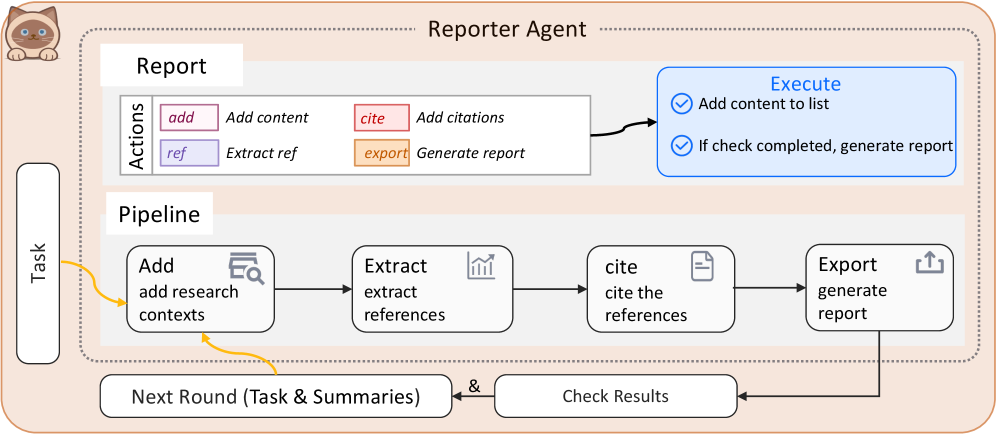
The diagram illustrates a multi-step workflow for a "Reporter Agent" system, which automates report generation through a pipeline of tasks, reference extraction, citation, and validation. The process includes feedback loops for iterative refinement.
### Components/Axes
1. **Main Sections**:
- **Reporter Agent**: Overarching system.
- **Report**: Contains actions (`add`, `ref`, `cite`, `export`).
- **Pipeline**: Sequential steps (`Add research contexts`, `Extract references`, `Cite references`, `Export report`).
- **Task**: Initiates the workflow.
- **Execute**: Conditional checks (`Add content to list`, `If check completed, generate report`).
2. **Flow Arrows**:
- Black arrows indicate sequential steps.
- Yellow arrow loops back from `Check Results` to `Next Round (Task & Summaries)`.
3. **Legend/Color Coding**:
- **Pink**: `add` (Add content).
- **Purple**: `ref` (Extract references).
- **Red**: `cite` (Add citations).
- **Orange**: `export` (Generate report).
- **Blue**: Conditional checks in the `Execute` section.
### Detailed Analysis
1. **Task Initiation**:
- The workflow begins with a `Task`, which triggers the addition of research contexts (`Add research contexts`).
2. **Pipeline Steps**:
- **Extract references**: Follows context addition.
- **Cite references**: References are cited after extraction.
- **Export report**: Final step in the pipeline, generating the report.
3. **Execute Section**:
- **Add content to list**: Validated via a checkmark (✓).
- **Conditional generation**: The report is only generated if the checkmark condition is met.
4. **Feedback Loop**:
- `Check Results` feeds back into `Next Round (Task & Summaries)`, enabling iterative refinement.
### Key Observations
- The workflow is linear but includes a feedback mechanism for iterative improvements.
- The `Execute` section acts as a gatekeeper, ensuring content is added and validated before finalizing the report.
- The `Next Round` loop suggests the system can refine outputs based on prior results.
### Interpretation
This diagram represents an automated, iterative reporting system designed for efficiency and accuracy. The feedback loop implies the agent can adapt to incomplete or evolving data, ensuring reports are comprehensive and validated. The color-coded actions (`add`, `ref`, `cite`, `export`) clarify the workflow’s modular structure, while the `Execute` checks enforce quality control. The system’s design prioritizes transparency and adaptability, critical for dynamic reporting environments.