## Diagram: Reporter Agent Workflow
### Overview
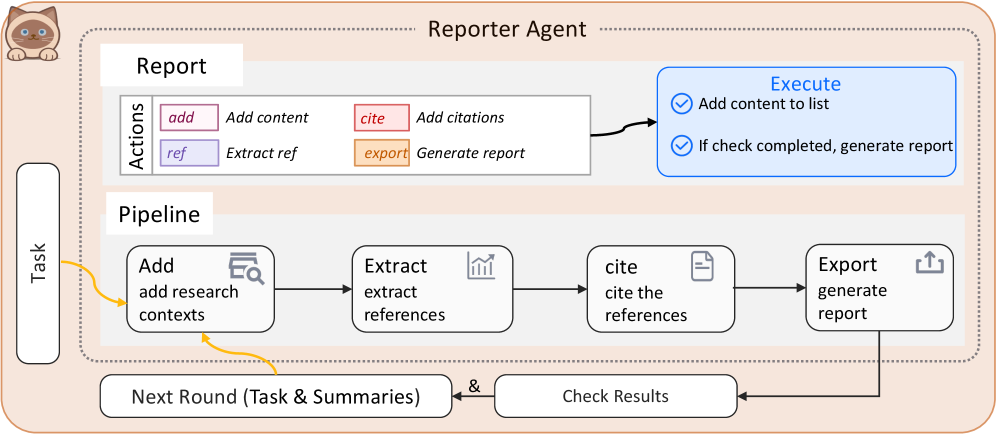
This image is a technical workflow diagram illustrating the architecture and process flow of a "Reporter Agent." The diagram is structured as a flowchart with labeled components, directional arrows, and a cyclical process. It uses a combination of text, icons, and color-coded action buttons to describe a system for generating reports through iterative research and citation.
### Components/Axes
The diagram is organized into several distinct regions and components:
1. **Header/Title:** The text "Reporter Agent" is centered at the top of the main container.
2. **Mascot/Icon:** A small, stylized cat icon is positioned in the top-left corner, outside the main process box.
3. **Main Container:** A large, light-peach-colored rounded rectangle with a dotted border encloses the core agent components.
4. **Input:** A vertical, rounded rectangle labeled "Task" is positioned to the left of the main container. A yellow arrow points from it into the main container.
5. **Internal Sections:** The main container is divided into three primary sections:
* **Report:** Contains an "Actions" box.
* **Pipeline:** Contains a four-step linear process flow.
* **Execute:** A blue-outlined box on the right side.
6. **Feedback Loop:** Below the main container, two rounded rectangles ("Next Round (Task & Summaries)" and "Check Results") are connected by arrows, forming a loop back into the Pipeline.
### Detailed Analysis
**1. Report Section (Top-Left of Main Container):**
* **Label:** "Report"
* **Actions Box:** A white box labeled "Actions" on its left side. It contains four color-coded action buttons:
* `add` (pink background): "Add content"
* `cite` (red background): "Add citations"
* `ref` (purple background): "Extract ref"
* `export` (orange background): "Generate report"
* A black arrow points from this Actions box to the "Execute" box.
**2. Execute Section (Top-Right of Main Container):**
* **Label:** "Execute" (in blue text).
* **Content:** A blue-outlined box containing two checklist items:
* (Checkmark icon) "Add content to list"
* (Checkmark icon) "If check completed, generate report"
**3. Pipeline Section (Center of Main Container):**
* **Label:** "Pipeline"
* **Process Flow:** A linear sequence of four rounded white boxes connected by black arrows:
1. **Add:** Icon of a document with a magnifying glass. Text: "Add" / "add research contexts".
2. **Extract:** Icon of a bar chart. Text: "Extract" / "extract references".
3. **cite:** Icon of a document with a citation mark. Text: "cite" / "cite the references".
4. **Export:** Icon of an upward arrow from a tray. Text: "Export" / "generate report".
* A yellow arrow from the "Task" input points into the "Add" step.
* A yellow arrow from the "Next Round" box also points into the "Add" step.
**4. Feedback Loop (Bottom):**
* **Check Results:** A white box to the right. An arrow from the "Export" step in the Pipeline points down to it.
* **Next Round (Task & Summaries):** A white box to the left. An arrow points from "Check Results" to this box.
* **Loop Connection:** An arrow points from "Next Round" back up to the "Add" step in the Pipeline, completing the cycle. An ampersand (`&`) symbol is placed between the two boxes.
### Key Observations
* **Iterative Process:** The diagram explicitly shows a cyclical workflow. The output from "Export" feeds into "Check Results," which then informs the "Next Round," which re-enters the pipeline at the "Add" stage. This suggests the agent operates in multiple rounds or iterations.
* **Action-Execution Separation:** The "Actions" (add, cite, ref, export) are defined separately from the "Execute" logic, which contains the conditional rule ("If check completed, generate report").
* **Color Coding:** Action buttons in the "Actions" box are color-coded (pink, red, purple, orange), but these colors are not reused elsewhere in the diagram's main flow.
* **Input/Output:** The primary external input is "Task." The final output is the "generate report" action, which occurs conditionally within the "Execute" box.
### Interpretation
This diagram models an autonomous or semi-autonomous AI agent designed for research and report generation. The workflow suggests a Peircean investigative cycle:
1. **Abduction (Hypothesis Generation):** The process begins with a "Task" and the "Add research contexts" step, where the agent gathers initial information or forms hypotheses.
2. **Deduction (Extraction & Structuring):** The "Extract references" and "cite the references" steps involve gathering evidence and structuring it with proper citations, moving from raw data to organized information.
3. **Induction (Verification & Iteration):** The "Export" step produces a draft or result, which is then subjected to "Check Results." This verification step is crucial. The loop back via "Next Round" indicates that the agent iteratively refines its output based on checks, new task parameters, or summaries from previous rounds. This mimics a scientific or scholarly process of revision.
4. **Action & Conclusion:** The final "generate report" action in the "Execute" box is conditional ("If check completed"), implying the agent only finalizes its output after passing an internal validation checkpoint.
The separation of the "Actions" library from the "Pipeline" execution flow indicates a modular design where the agent's capabilities (adding, citing, etc.) are defined separately from the specific sequence in which they are applied for a given task. The entire system is geared towards producing well-researched, cited reports through a self-correcting, iterative loop.