## Line Chart: Similarity Across Reasoning Steps for Various AI Models
### Overview
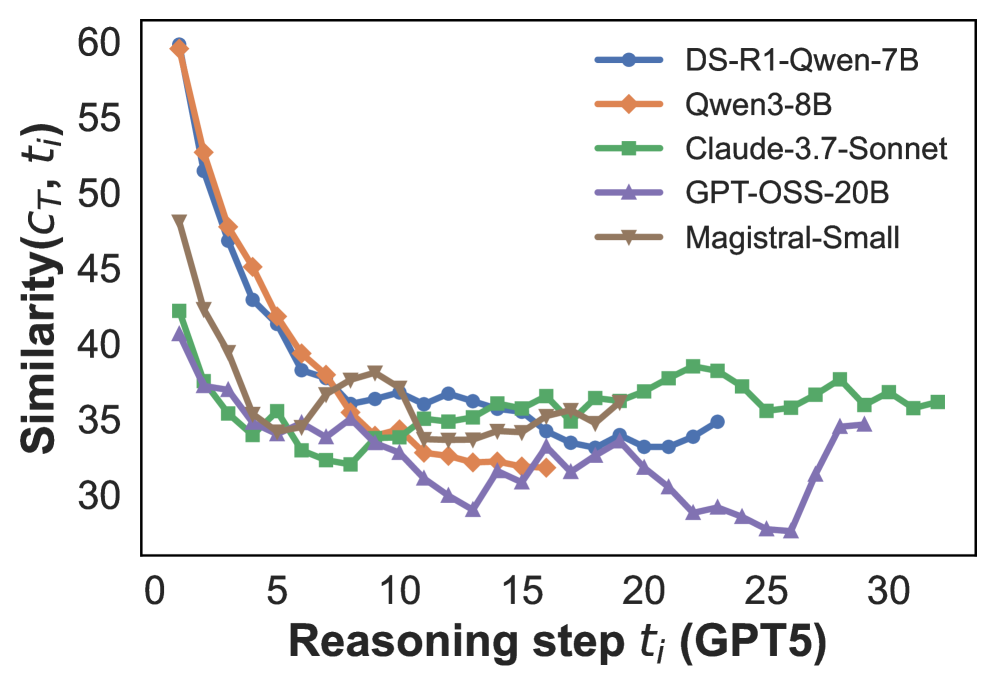
This image is a line chart comparing the "Similarity" metric (denoted as \(C_T, t_i\)) across sequential "Reasoning steps" (denoted as \(t_i\)) for five different AI models. The chart illustrates how the similarity of each model's output or internal state changes as the reasoning process progresses through steps, presumably benchmarked against a reference model (GPT5, as indicated in the x-axis label).
### Components/Axes
* **Y-Axis:** Labeled **"Similarity(\(C_T, t_i\))"**. The scale ranges from 30 to 60, with major tick marks at intervals of 5 (30, 35, 40, 45, 50, 55, 60).
* **X-Axis:** Labeled **"Reasoning step \(t_i\) (GPT5)"**. The scale ranges from 0 to 30, with major tick marks at intervals of 5 (0, 5, 10, 15, 20, 25, 30).
* **Legend:** Positioned in the top-right quadrant of the chart area. It contains five entries, each with a colored line segment and a marker:
1. **DS-R1-Qwen-7B:** Blue line with circular markers.
2. **Qwen3-8B:** Orange line with diamond markers.
3. **Claude-3.7-Sonnet:** Green line with square markers.
4. **GPT-OSS-20B:** Purple line with upward-pointing triangle markers.
5. **Magistral-Small:** Brown line with downward-pointing triangle markers.
### Detailed Analysis
**Trend Verification & Data Point Extraction (Approximate Values):**
All series show a general downward trend in similarity as reasoning steps increase, with varying rates of decline and stabilization patterns.
1. **DS-R1-Qwen-7B (Blue, Circles):**
* **Trend:** Starts very high, drops steeply until step ~10, then stabilizes with minor fluctuations.
* **Approximate Points:** (1, 60), (2, 53), (3, 47), (4, 43), (5, 40), (6, 38), (7, 37), (8, 36), (9, 36), (10, 36), (11, 36), (12, 36), (13, 36), (14, 36), (15, 35), (16, 34), (17, 34), (18, 34), (19, 34), (20, 34), (21, 34), (22, 35), (23, 35).
2. **Qwen3-8B (Orange, Diamonds):**
* **Trend:** Starts at the highest point, drops very steeply until step ~12, then continues a slower decline.
* **Approximate Points:** (1, 60), (2, 53), (3, 48), (4, 45), (5, 42), (6, 40), (7, 38), (8, 37), (9, 36), (10, 35), (11, 34), (12, 33), (13, 32), (14, 32), (15, 32), (16, 32).
3. **Claude-3.7-Sonnet (Green, Squares):**
* **Trend:** Starts lower than the first two, drops quickly until step ~7, then shows a slight recovery and stabilizes at a level higher than the others after step 15.
* **Approximate Points:** (1, 42), (2, 38), (3, 36), (4, 35), (5, 36), (6, 34), (7, 33), (8, 32), (9, 33), (10, 34), (11, 35), (12, 35), (13, 35), (14, 36), (15, 36), (16, 37), (17, 36), (18, 37), (19, 37), (20, 38), (21, 39), (22, 39), (23, 38), (24, 37), (25, 36), (26, 36), (27, 37), (28, 38), (29, 37), (30, 36), (31, 36), (32, 36).
4. **GPT-OSS-20B (Purple, Up-Triangles):**
* **Trend:** Starts the lowest, declines steadily to a minimum around step 25, then shows a sharp increase.
* **Approximate Points:** (1, 41), (2, 37), (3, 37), (4, 35), (5, 34), (6, 34), (7, 33), (8, 34), (9, 33), (10, 32), (11, 31), (12, 30), (13, 29), (14, 31), (15, 32), (16, 31), (17, 32), (18, 34), (19, 33), (20, 32), (21, 30), (22, 29), (23, 29), (24, 28), (25, 28), (26, 28), (27, 31), (28, 35), (29, 35).
5. **Magistral-Small (Brown, Down-Triangles):**
* **Trend:** Starts high, drops steeply, then exhibits more volatility (ups and downs) compared to other series before stabilizing.
* **Approximate Points:** (1, 48), (2, 43), (3, 40), (4, 38), (5, 35), (6, 35), (7, 36), (8, 37), (9, 38), (10, 37), (11, 36), (12, 35), (13, 34), (14, 34), (15, 35), (16, 36), (17, 36), (18, 36).
### Key Observations
1. **Universal Initial Drop:** All models show their highest similarity at the first reasoning step, followed by a significant decline. This suggests the initial output or state is most aligned with the reference (GPT5), and divergence increases with more reasoning.
2. **Convergence Zone:** Between steps 5 and 15, most models' similarity scores converge into a narrower band (approximately 32-38), indicating a phase where model behaviors become more similar relative to their starting points.
3. **Divergence After Step 15:** Post step 15, the models separate again. Claude-3.7-Sonnet (Green) maintains and even slightly increases its similarity, becoming the highest. GPT-OSS-20B (Purple) continues to drop to the lowest point before a late rebound. DS-R1-Qwen-7B (Blue) and Magistral-Small (Brown) stabilize in the middle.
4. **Outlier Behavior:** GPT-OSS-20B's sharp increase after step 25 is a notable anomaly compared to the general trends of other models.
5. **Model Grouping:** The two Qwen-based models (DS-R1-Qwen-7B and Qwen3-8B) start identically high but separate slightly, with Qwen3-8B ending lower. Claude-3.7-Sonnet demonstrates the most resilient similarity over long reasoning chains.
### Interpretation
This chart likely visualizes a study on how different large language models (LLMs) diverge from a reference model's (GPT5) reasoning trajectory. The "Similarity" metric could measure the overlap in generated text, attention patterns, or latent space representations at each step.
* **What the data suggests:** The process of multi-step reasoning causes models to develop distinct "thought paths." The initial step is highly constrained or prompted, leading to high similarity. As models generate more steps, their unique architectures, training data, and inference algorithms cause them to explore different reasoning branches, reducing similarity.
* **How elements relate:** The x-axis represents the progression of a complex task. The y-axis measures alignment with a benchmark. The different lines represent competing approaches. The chart answers: "Which models stay closer to GPT5's reasoning for longer, and when do they fundamentally diverge?"
* **Notable implications:** Claude-3.7-Sonnet's sustained higher similarity might indicate a reasoning style more aligned with GPT5's, or greater stability. The late surge in GPT-OSS-20B's similarity could suggest a "correction" mechanism or a convergence on a solution after an initial exploratory phase. The steep initial drop for all models highlights the challenge of maintaining alignment in multi-step deduction or generation tasks.