## Chart: Validation Score vs. Training Step for AIME25 Benchmark
### Overview
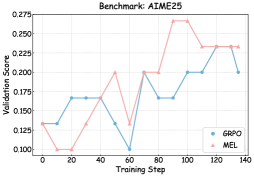
The image is a line chart comparing the validation scores of two models, GRPO and MEL, over training steps for the AIME25 benchmark. The x-axis represents the training step, and the y-axis represents the validation score.
### Components/Axes
* **Title:** Benchmark: AIME25
* **X-axis:** Training Step (values range from 0 to 140 in increments of 20)
* **Y-axis:** Validation Score (values range from 0.100 to 0.275)
* **Legend:** Located in the bottom-right corner.
* GRPO (Blue line with circle markers)
* MEL (Pink line with triangle markers)
### Detailed Analysis
* **GRPO (Blue line with circle markers):**
* Trend: Initially increases, then decreases, then increases again, with some plateaus.
* Data Points:
* Step 0: ~0.13
* Step 20: ~0.17
* Step 40: ~0.17
* Step 60: ~0.13
* Step 80: ~0.20
* Step 100: ~0.20
* Step 120: ~0.23
* Step 140: ~0.20
* **MEL (Pink line with triangle markers):**
* Trend: Initially flat, then increases sharply, then plateaus, then decreases slightly.
* Data Points:
* Step 0: ~0.13
* Step 20: ~0.10
* Step 40: ~0.17
* Step 60: ~0.20
* Step 80: ~0.20
* Step 100: ~0.27
* Step 120: ~0.23
* Step 140: ~0.23
### Key Observations
* MEL initially performs worse than GRPO but eventually reaches a higher validation score around step 100.
* Both models show fluctuations in validation score throughout the training process.
* GRPO seems to plateau around a validation score of 0.20 after step 80.
* MEL plateaus at a higher validation score of approximately 0.23 after step 120.
### Interpretation
The chart compares the performance of two models, GRPO and MEL, on the AIME25 benchmark. The validation scores indicate how well each model generalizes to unseen data during training. MEL initially lags behind GRPO but eventually surpasses it, suggesting that MEL might be a better model for this benchmark given sufficient training. The fluctuations in validation scores indicate that both models experience periods of improvement and stagnation during training. The plateaus suggest that the models may have reached a point of diminishing returns, where further training does not significantly improve performance.