\n
## Line Chart: Validation Score vs. Training Step (Benchmark: AIME25)
### Overview
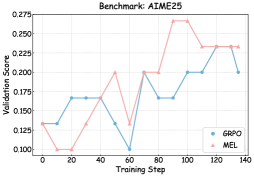
This image presents a line chart illustrating the validation score of two models, GRPO and MEL, as a function of the training step. The chart appears to track the performance of these models during a training process on the AIME25 benchmark.
### Components/Axes
* **Title:** Benchmark: AIME25 (positioned at the top-center)
* **X-axis:** Training Step (ranging from approximately 0 to 140, with tick marks at intervals of 20)
* **Y-axis:** Validation Score (ranging from approximately 0.10 to 0.275, with tick marks at intervals of 0.025)
* **Legend:** Located in the bottom-right corner.
* GRPO (represented by a blue line with circular markers)
* MEL (represented by a pink/red line with circular markers)
* **Gridlines:** Present to aid in reading values.
### Detailed Analysis
**GRPO (Blue Line):**
The GRPO line generally trends upward, but with significant fluctuations.
* At Training Step 0, the Validation Score is approximately 0.125.
* At Training Step 20, the Validation Score rises to approximately 0.165.
* At Training Step 40, the Validation Score decreases to approximately 0.16.
* At Training Step 60, the Validation Score drops sharply to approximately 0.11.
* At Training Step 80, the Validation Score increases to approximately 0.165.
* At Training Step 100, the Validation Score rises to approximately 0.20.
* At Training Step 120, the Validation Score increases to approximately 0.225.
* At Training Step 140, the Validation Score decreases to approximately 0.22.
**MEL (Pink/Red Line):**
The MEL line exhibits more pronounced fluctuations than GRPO, with a clear peak around Training Step 80.
* At Training Step 0, the Validation Score is approximately 0.10.
* At Training Step 20, the Validation Score rises to approximately 0.13.
* At Training Step 40, the Validation Score increases to approximately 0.20.
* At Training Step 60, the Validation Score decreases to approximately 0.15.
* At Training Step 80, the Validation Score peaks at approximately 0.26.
* At Training Step 100, the Validation Score decreases to approximately 0.21.
* At Training Step 120, the Validation Score increases to approximately 0.23.
* At Training Step 140, the Validation Score decreases to approximately 0.225.
### Key Observations
* The MEL model consistently achieves higher validation scores than the GRPO model, especially after Training Step 40.
* Both models exhibit significant variance in their validation scores, suggesting instability during training.
* The MEL model shows a clear peak in performance around Training Step 80, followed by a slight decline.
* The GRPO model shows a general upward trend, but with more erratic behavior.
### Interpretation
The chart demonstrates the training progress of two models (GRPO and MEL) on the AIME25 benchmark. The higher validation scores of the MEL model suggest it is performing better overall. However, the fluctuations in both lines indicate that the training process may not be fully converged or that the models are sensitive to the specific training data. The peak in MEL's performance at Training Step 80 could indicate an optimal point for early stopping or model checkpointing. The variance in validation scores suggests that further investigation into the training process, such as hyperparameter tuning or data augmentation, might be beneficial to improve model stability and generalization. The AIME25 benchmark appears to be a validation set used to assess the performance of these models during training. The chart provides a visual representation of how well each model is learning to generalize to unseen data.