## Scatter Plot: Model Performance vs. Parameter Count
### Overview
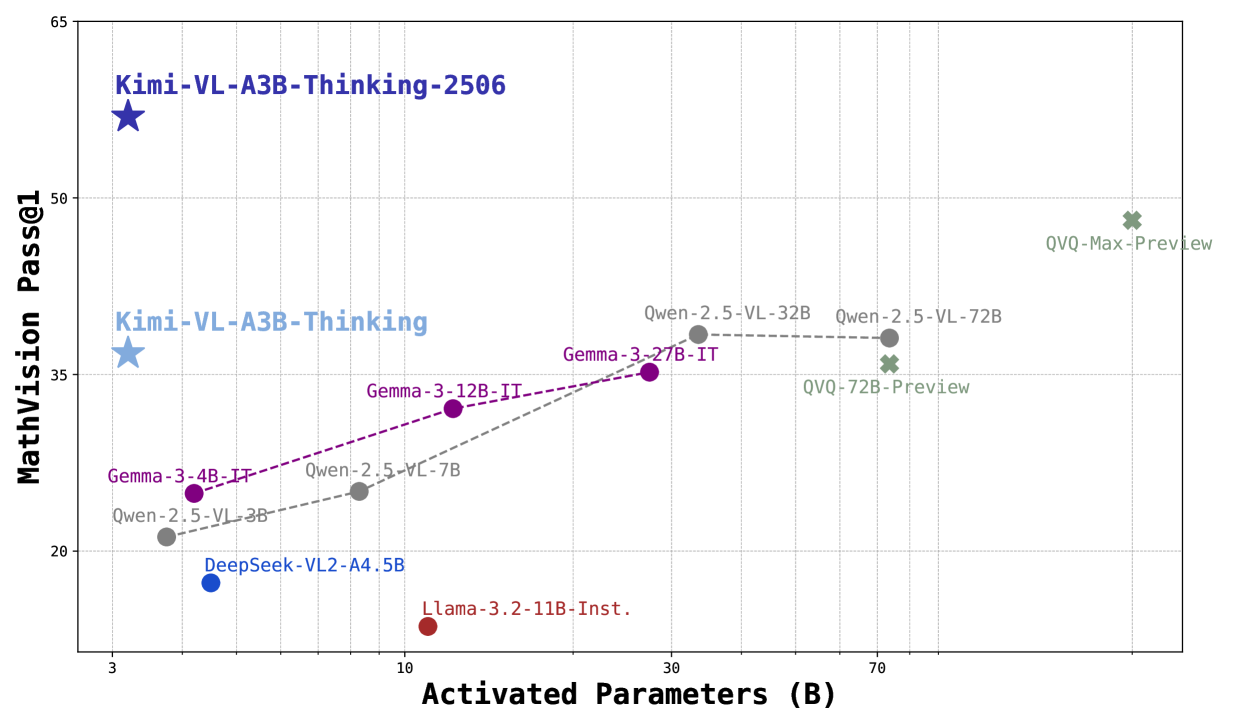
The image is a scatter plot comparing the performance of various AI models (MathVision Pass@1) against their activated parameter counts (in billions). The plot includes labeled data points, connecting lines for model families, and a legend for color coding. Key trends show a general relationship between parameter count and performance, with notable outliers.
---
### Components/Axes
- **X-axis**: "Activated Parameters (B)" with ticks at 3, 10, 30, 70, and 80 billion parameters.
- **Y-axis**: "MathVision Pass@1" with ticks from 15 to 65.
- **Legend**: Located on the right, mapping colors to model families:
- **Blue**: Kimi
- **Purple**: Gemma
- **Gray**: Owen
- **Green**: QVQ
- **Red**: DeepSeek and Llama
- **Data Points**: Labeled with model names, parameter counts, and versions (e.g., "Kimi-VL-A3B-Thinking-2506").
- **Lines**: Dashed lines connect data points for model families (e.g., Owen-2.5-VL-3B → Owen-2.5-VL-7B → Owen-2.5-VL-32B).
---
### Detailed Analysis
#### Data Points and Trends
1. **Kimi Models**:
- **Kimi-VL-A3B-Thinking-2506**: 3B parameters, 55 Pass@1 (top-left).
- **Kimi-VL-A3B-Thinking**: 3B parameters, 35 Pass@1 (lower-left).
- **Trend**: Horizontal line at 3B parameters, showing no improvement in Pass@1 with parameter count.
2. **Gemma Models**:
- **Gemma-3-4B-IT**: 3B parameters, 25 Pass@1.
- **Gemma-3-12B-IT**: 10B parameters, 35 Pass@1.
- **Gemma-3-27B-IT**: 30B parameters, 35 Pass@1.
- **Trend**: Dashed purple line slopes upward, indicating improved performance with parameter count up to 30B.
3. **Owen Models**:
- **Owen-2.5-VL-3B**: 3B parameters, 20 Pass@1.
- **Owen-2.5-VL-7B**: 10B parameters, 25 Pass@1.
- **Owen-2.5-VL-32B**: 30B parameters, 35 Pass@1.
- **Owen-2.5-VL-72B**: 70B parameters, 35 Pass@1.
- **Trend**: Dashed gray line slopes upward, then plateaus at 35 Pass@1 despite increased parameters.
4. **QVQ Models**:
- **QVQ-72B-Preview**: 70B parameters, 35 Pass@1.
- **QVQ-Max-Preview**: 80B parameters, 48 Pass@1.
- **Trend**: Dashed green line slopes upward, showing significant improvement at 80B parameters.
5. **DeepSeek and Llama**:
- **DeepSeek-VL2-A4.5B**: 5B parameters, 18 Pass@1.
- **Llama-3.2-11B-Inst.**: 11B parameters, 15 Pass@1.
- **Trend**: No connecting lines; isolated points with low Pass@1 scores.
---
### Key Observations
1. **Parameter Efficiency**:
- Kimi models achieve high Pass@1 (55) with minimal parameters (3B), suggesting superior efficiency.
- QVQ models require 80B parameters to reach 48 Pass@1, indicating lower efficiency.
2. **Performance Plateaus**:
- Owen and Gemma models plateau at 35 Pass@1 despite increasing parameters beyond 30B, suggesting diminishing returns.
3. **Outliers**:
- **QVQ-Max-Preview**: Highest Pass@1 (48) but requires 80B parameters, making it an outlier in efficiency.
- **Kimi-VL-A3B-Thinking-2506**: Highest Pass@1 (55) with only 3B parameters, another efficiency outlier.
4. **Low-Performance Models**:
- DeepSeek and Llama models have the lowest Pass@1 scores (15–18) despite moderate parameter counts (5–11B).
---
### Interpretation
The data suggests that **parameter count alone does not guarantee performance**. Kimi models demonstrate exceptional efficiency, achieving high Pass@1 scores with minimal parameters. In contrast, QVQ models require significantly more parameters for comparable or lower performance, highlighting potential over-parameterization. The Owen and Gemma models show a trend where increasing parameters improves performance up to a point (30B), after which gains plateau. This implies that architectural innovations (e.g., Kimi’s design) may be more critical than raw parameter count. The low performance of DeepSeek and Llama models suggests limitations in their training or optimization strategies. Overall, the plot underscores the importance of balancing parameter efficiency with model architecture for optimal results.