## Scatter Plot: Model Performance vs. Parameters
### Overview
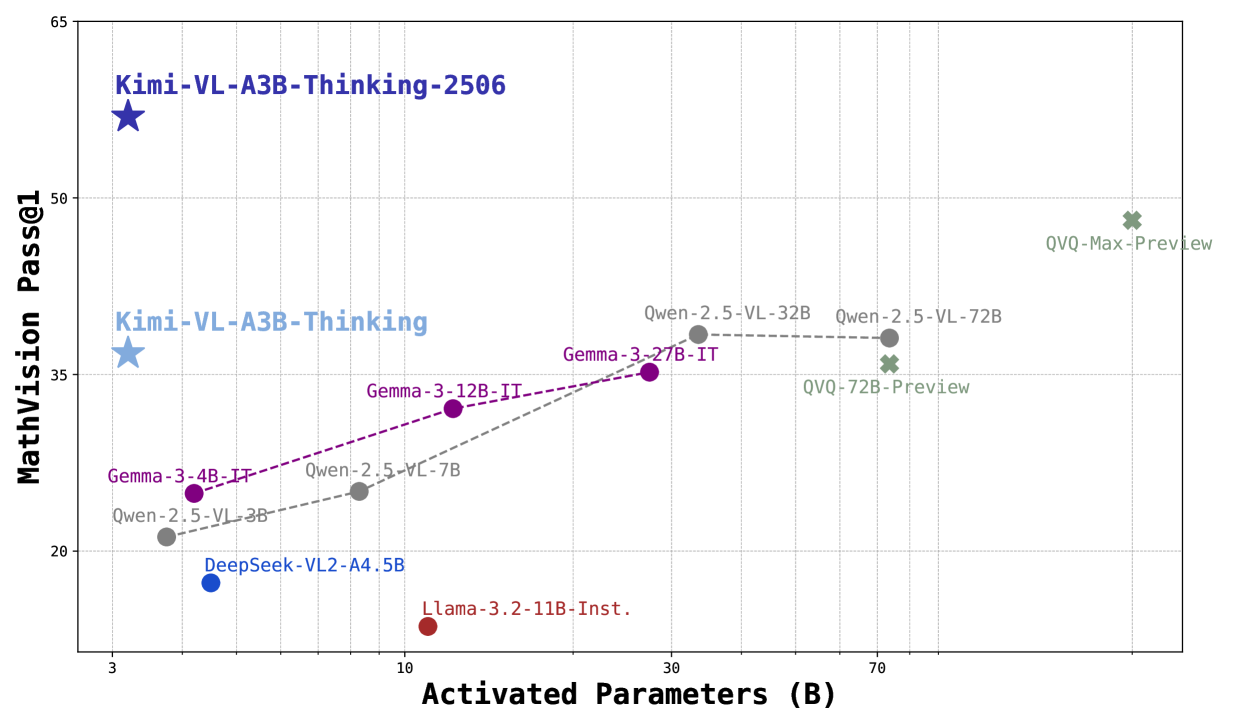
This image presents a scatter plot comparing the performance of various models on a MathVision Pass@1 task against the number of activated parameters they utilize. Each model is represented by a data point, and a trend line is fitted to a subset of the models. The plot aims to illustrate the relationship between model size (parameter count) and mathematical reasoning ability.
### Components/Axes
* **X-axis:** Activated Parameters (B) - Scale ranges from approximately 3 to 75 Billion parameters.
* **Y-axis:** MathVision Pass@1 - Scale ranges from approximately 25 to 65.
* **Data Points:** Represent individual models.
* **Trend Line:** A dashed red line attempting to show the correlation between parameters and performance for a subset of models.
* **Legend:** Implicitly defined by the labels next to each data point.
### Detailed Analysis
The following data points are visible, with approximate values read from the plot:
* **Kimi-VL-A3B-Thinking-2506 (Purple Star):** Approximately (3, 35.5).
* **Kimi-VL-A3B-Thinking (Purple Star):** Approximately (3, 33).
* **DeepSeek-VL2-44.5B (Dark Blue Circle):** Approximately (7, 27).
* **Llama-3.2-11B-Inst. (Dark Blue Circle):** Approximately (11, 27.5).
* **Gemma-3-4B-IT (Orange Circle):** Approximately (11, 30).
* **Owen-2.5-VL-3B (Orange Circle):** Approximately (11, 29).
* **Gemma-3-12B-IT (Orange Circle):** Approximately (33, 33).
* **Qwen-2.5-VL-32B (Red Circle):** Approximately (33, 35).
* **Qwen-2.5-VL-72B (Red Circle):** Approximately (73, 36).
* **QVQ-72B-Preview (Red Circle):** Approximately (73, 52).
* **QVQ-Max-Preview (Red Circle):** Approximately (73, 54).
* **Owen-2.5-VL-7B (Orange Circle):** Approximately (11, 31).
The trend line (dashed red) connects the following points: Gemma-3-4B-IT, Gemma-3-12B-IT, Qwen-2.5-VL-32B, Qwen-2.5-VL-72B. The line shows a generally upward trend, indicating that as the number of activated parameters increases, the MathVision Pass@1 score tends to increase as well.
### Key Observations
* **Outliers:** Kimi-VL-A3B-Thinking-2506 and Kimi-VL-A3B-Thinking show relatively high performance with a small number of parameters compared to other models.
* **Trend:** The trend line suggests a positive correlation between model size and performance, but the correlation is not strong, as evidenced by the scatter of points around the line.
* **Clustering:** Models with similar parameter counts tend to cluster together, particularly in the 10-12B range.
* **QVQ Models:** The QVQ models (QVQ-72B-Preview and QVQ-Max-Preview) demonstrate the highest performance, but also require the largest number of parameters.
### Interpretation
The data suggests that increasing the number of activated parameters generally improves performance on the MathVision Pass@1 task. However, the relationship is not linear, and there is significant variation among models with similar parameter counts. The Kimi models stand out as achieving high performance with relatively few parameters, suggesting a potentially more efficient architecture or training methodology. The QVQ models represent the state-of-the-art in terms of performance, but at the cost of significantly increased computational resources. The trend line provides a rough estimate of the expected performance gain for a given increase in parameters, but it should be interpreted with caution due to the scatter in the data. The plot highlights the trade-off between model size, performance, and computational cost in the context of mathematical reasoning.