## Chart/Diagram Type: Combined Diagram
### Overview
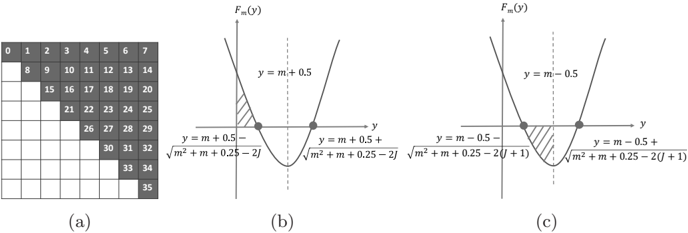
The image presents a combined diagram consisting of a grid and two parabolic graphs. The grid in (a) shows a pattern of filled and empty cells, while the graphs in (b) and (c) depict parabolic functions with shaded areas.
### Components/Axes
* **(a) Grid:** A grid of cells numbered from 0 to 35. Some cells are filled with gray, while others are empty.
* **(b) Parabolic Graph:**
* **Axes:** Labeled as *Fm(y)* (vertical axis) and *y* (horizontal axis).
* **Parabola:** A parabola opening upwards.
* **Vertical Dashed Line:** Located at *y = m + 0.5*.
* **Horizontal Axis Markers:**
* *y = m + 0.5 - sqrt(m^2 + m + 0.25 - 2j)*
* *y = m + 0.5 + sqrt(m^2 + m + 0.25 - 2j)*
* **Text Label:** *y = m + 0.5* near the vertical dashed line.
* **Shaded Area:** The area between the parabola and the y-axis, to the left of the vertical dashed line, is shaded.
* **(c) Parabolic Graph:**
* **Axes:** Labeled as *Fm(y)* (vertical axis) and *y* (horizontal axis).
* **Parabola:** A parabola opening upwards.
* **Vertical Dashed Line:** Located at *y = m - 0.5*.
* **Horizontal Axis Markers:**
* *y = m - 0.5 - sqrt(m^2 + m + 0.25 - 2(j+1))*
* *y = m - 0.5 + sqrt(m^2 + m + 0.25 - 2(j+1))*
* **Text Label:** *y = m - 0.5* near the vertical dashed line.
* **Shaded Area:** The area between the parabola and the y-axis, to the right of the vertical dashed line, is shaded.
### Detailed Analysis or Content Details
* **(a) Grid Pattern:** The grid is filled with gray cells in a triangular pattern starting from the top-left corner. The filled cells extend diagonally downwards.
* Row 1: Cells 0-7 are filled.
* Row 2: Cells 8-14 are filled.
* Row 3: Cells 15-20 are filled.
* Row 4: Cells 21-25 are filled.
* Row 5: Cells 26-29 are filled.
* Row 6: Cells 30-32 are filled.
* Row 7: Cells 33-34 are filled.
* Row 8: Cell 35 is filled.
* **(b) Parabola:** The parabola in (b) is centered around the vertical line *y = m + 0.5*. The shaded area is to the left of this line. The roots of the parabola are defined by the expressions involving the square root.
* **(c) Parabola:** The parabola in (c) is centered around the vertical line *y = m - 0.5*. The shaded area is to the right of this line. The roots of the parabola are defined by the expressions involving the square root.
### Key Observations
* The grid pattern in (a) shows a decreasing number of filled cells as you move down the grid.
* The parabolas in (b) and (c) are similar in shape but are shifted horizontally.
* The shaded areas in (b) and (c) are on opposite sides of the vertical lines.
* The horizontal axis markers represent the roots of the parabolic functions.
### Interpretation
The image likely illustrates a concept related to probability, statistics, or signal processing. The grid in (a) could represent a matrix or a discrete space, while the parabolas in (b) and (c) could represent probability density functions or some other type of distribution. The shaded areas might represent probabilities or integrals of these functions. The parameters *m* and *j* likely play a role in defining the shape and position of these distributions. The shift between the parabolas in (b) and (c) suggests a change in a parameter or condition. The square root terms in the horizontal axis markers likely relate to the variance or spread of the distributions.