\n
## Diagram: Potential Energy and Force Relationships
### Overview
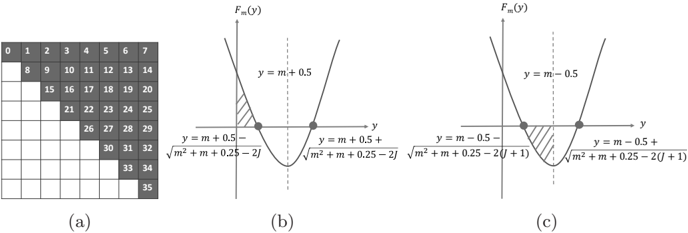
The image presents a visual representation of the relationship between potential energy (U) and force (Fm(y)) for a system. It consists of a grid labeled (a), and two diagrams labeled (b) and (c) illustrating different scenarios. The diagrams depict parabolic curves representing potential energy and linear functions representing force. Shaded triangular areas are highlighted in diagrams (b) and (c).
### Components/Axes
* **(a) Grid:** A 7x5 grid with cells numbered 1 through 35. The grid appears to be a reference for spatial organization, but does not contain data.
* **(b) Diagram:**
* **Axes:** Vertical axis labeled "y", representing position. Vertical axis labeled "Fm(y)", representing force.
* **Curves:** A parabolic curve representing potential energy, defined by the equation: `y = m + 0.5 - √(m² + m + 0.25 - 2j)`
* **Line:** A straight line representing force, defined by the equation: `y = m - 0.5`
* **Shaded Area:** A triangular area bounded by the y-axis, the force line, and the potential energy curve.
* **(c) Diagram:**
* **Axes:** Vertical axis labeled "y", representing position. Vertical axis labeled "Fm(y)", representing force.
* **Curves:** A parabolic curve representing potential energy, defined by the equation: `y = m + 0.5 - √(m² + m + 0.25 - 2(j + 1))`
* **Line:** A straight line representing force, defined by the equation: `y = m - 0.5`
* **Shaded Area:** A triangular area bounded by the y-axis, the force line, and the potential energy curve.
### Detailed Analysis or Content Details
* **Diagram (b):**
* The parabolic curve opens upwards. The vertex of the parabola is located at a y-value determined by the equation `y = m + 0.5 - √(m² + m + 0.25 - 2j)`.
* The linear force function has a negative slope of -0.5.
* The shaded area represents work done or energy transfer.
* **Diagram (c):**
* The parabolic curve opens upwards. The vertex of the parabola is located at a y-value determined by the equation `y = m + 0.5 - √(m² + m + 0.25 - 2(j + 1))`.
* The linear force function has a negative slope of -0.5.
* The shaded area represents work done or energy transfer. The equation for the parabola is slightly different than in diagram (b), with the addition of `2(j + 1)` inside the square root.
### Key Observations
* Both diagrams (b) and (c) depict similar relationships between force and potential energy, but with a slight variation in the potential energy curve's equation.
* The shaded areas in both diagrams represent a quantifiable amount of energy, likely related to the work done by the force.
* The grid (a) does not appear to be directly related to the diagrams (b) and (c) in terms of data representation. It may be a reference for a larger system or a coordinate system.
### Interpretation
The diagrams illustrate the connection between potential energy and force. The parabolic shape of the potential energy curve indicates a restoring force proportional to the displacement from equilibrium. The linear function represents the force acting on the system. The shaded areas likely represent the work done by the force in moving an object between two points, which corresponds to a change in potential energy.
The difference in the potential energy equation between diagrams (b) and (c) suggests a change in a parameter 'j', which affects the shape and position of the potential energy curve. This could represent a change in system properties or external conditions. The diagrams are likely used to demonstrate a physical principle, such as Hooke's Law or simple harmonic motion, and the relationship between potential energy, force, and displacement. The grid (a) may be a reference for a larger system or a coordinate system, but its specific role is unclear without further context.