## Histogram: Distribution of Betweenness Centrality Across All Iterations
### Overview
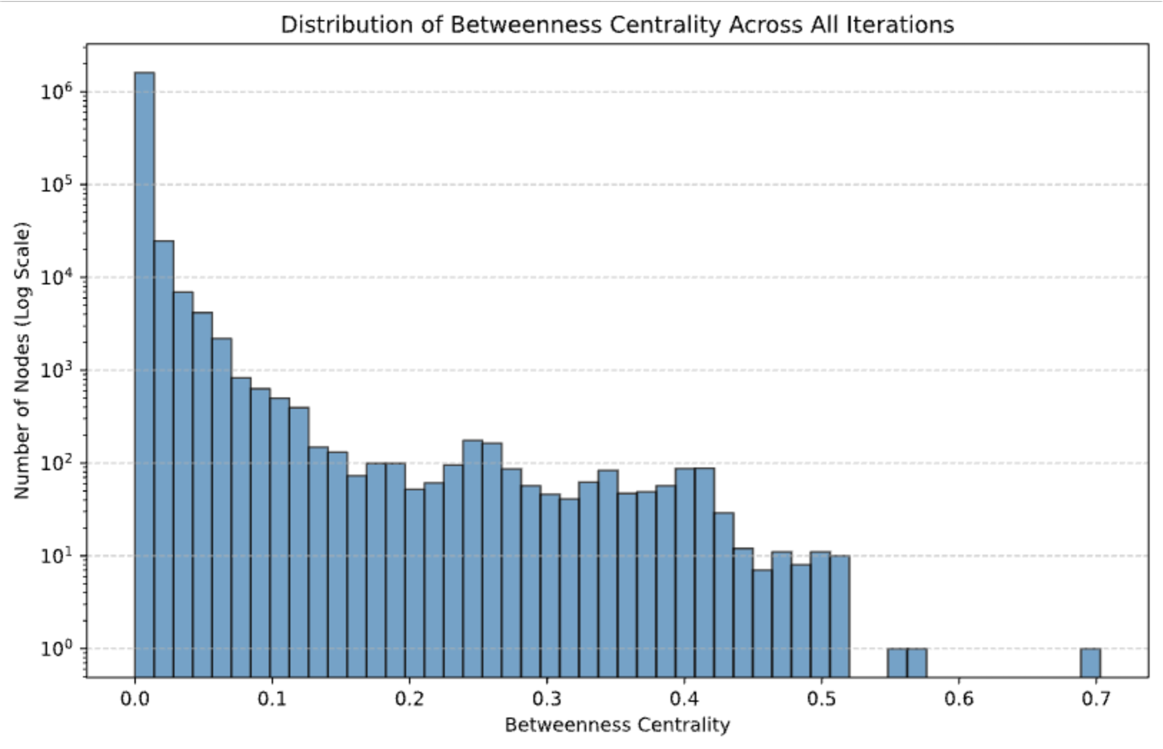
The image is a histogram showing the distribution of betweenness centrality across all iterations. The x-axis represents betweenness centrality, and the y-axis represents the number of nodes on a logarithmic scale. The histogram bars are light blue.
### Components/Axes
* **Title:** Distribution of Betweenness Centrality Across All Iterations
* **X-axis:** Betweenness Centrality, ranging from 0.0 to 0.7 in increments of 0.1.
* **Y-axis:** Number of Nodes (Log Scale), ranging from 10^0 (1) to 10^6 (1,000,000).
* **Bars:** Light blue bars representing the frequency of nodes at each betweenness centrality value.
### Detailed Analysis
The histogram shows a distribution where the majority of nodes have low betweenness centrality.
* **Betweenness Centrality 0.0:** The number of nodes is approximately 1.2 * 10^6.
* **Betweenness Centrality 0.0 - 0.1:** The number of nodes decreases rapidly.
* **Betweenness Centrality 0.1 - 0.5:** The number of nodes fluctuates between 10^1 and 10^2.
* **Betweenness Centrality 0.5 - 0.7:** The number of nodes is very low, close to 10^0.
Specific data points (approximate due to histogram format):
* 0.0: ~1,200,000
* 0.05: ~30,000
* 0.1: ~3,000
* 0.15: ~300
* 0.2: ~150
* 0.25: ~100
* 0.3: ~80
* 0.35: ~50
* 0.4: ~40
* 0.45: ~20
* 0.5: ~10
* 0.55: ~2
* 0.6: ~1
* 0.65: ~1
* 0.7: ~1
### Key Observations
* The distribution is heavily skewed to the right, indicating that most nodes have low betweenness centrality.
* There is a significant drop in the number of nodes between 0.0 and 0.1.
* The number of nodes with betweenness centrality greater than 0.5 is very small.
### Interpretation
The histogram suggests that in the network being analyzed, a large number of nodes have very little influence in terms of connecting other nodes (low betweenness centrality). A small fraction of nodes have a high degree of influence, acting as key connectors within the network. This type of distribution is common in many real-world networks, where a few central nodes play a critical role in maintaining connectivity and information flow. The logarithmic scale on the y-axis is necessary to visualize the wide range of node counts, highlighting the disparity between the highly central nodes and the vast majority of nodes with low centrality.