# Technical Document Extraction: Heatmap Analysis
## 1. **Axis Labels and Titles**
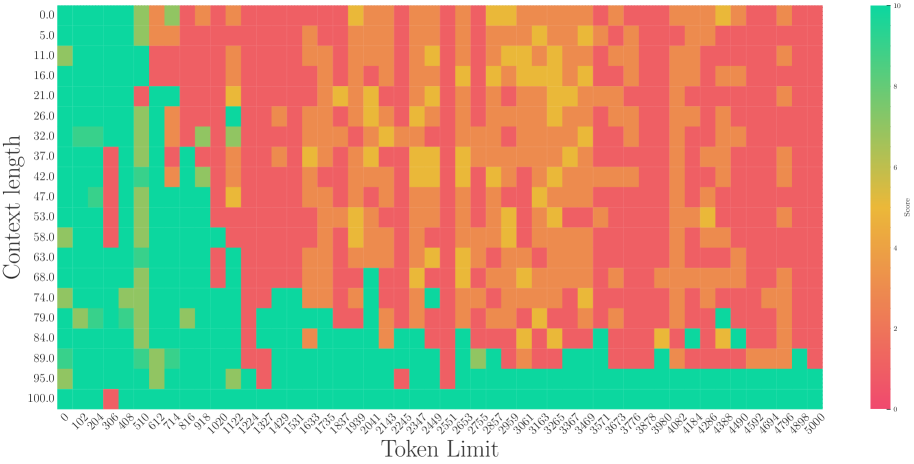
- **X-Axis (Horizontal):**
- Label: `Token Limit`
- Range: `0` to `5000`
- Increment: `100` (e.g., `0, 100, 200, ..., 5000`)
- **Y-Axis (Vertical):**
- Label: `Context Length`
- Range: `0` to `100`
- Increment: `5` (e.g., `0, 5, 10, ..., 100`)
- **Color Bar (Legend):**
- Label: `Score`
- Range: `0` (red) to `10` (green)
## 2. **Key Trends and Data Points**
- **General Pattern:**
- Scores decrease as `Token Limit` increases (left-to-right gradient from green to red).
- Scores decrease as `Context Length` increases (bottom-to-top gradient from green to red).
- **Notable Features:**
- **Vertical Green Stripe:**
- Located at `Token Limit ≈ 500`.
- Scores range from `8` (green) to `10` (bright green) across all `Context Length` values.
- **Horizontal Green Bands:**
- Observed at lower `Context Length` values (`0–20`).
- Scores remain high (`6–10`) even at higher `Token Limits` (e.g., `1000–2000`).
- **Red Dominance:**
- Upper-right quadrant (`Token Limit > 2000`, `Context Length > 50`) shows predominantly low scores (`0–2`).
## 3. **Legend and Color Mapping**
- **Legend Position:** Right side of the heatmap.
- **Color Gradient:**
- `Red` → `0` (lowest score)
- `Yellow-Orange` → `4–6` (mid-range scores)
- `Green` → `8–10` (highest scores)
## 4. **Spatial Grounding of Data Points**
- **High-Score Regions:**
- **Cluster 1:** `Token Limit = 0–500`, `Context Length = 0–20` (green/yellow).
- **Cluster 2:** `Token Limit = 500`, all `Context Length` (green stripe).
- **Low-Score Regions:**
- `Token Limit > 2000`, `Context Length > 50` (red).
## 5. **Trend Verification**
- **Token Limit vs. Score:**
- Scores decline monotonically with increasing `Token Limit` (e.g., `Token Limit = 0` → `Score ≈ 10`; `Token Limit = 5000` → `Score ≈ 0`).
- **Context Length vs. Score:**
- Scores decline monotonically with increasing `Context Length` (e.g., `Context Length = 0` → `Score ≈ 10`; `Context Length = 100` → `Score ≈ 0`).
## 6. **Component Isolation**
- **Header:** No explicit title or subtitle visible.
- **Main Chart:**
- Grid of colored squares representing scores.
- Axes and color bar provide reference for interpretation.
- **Footer:** Color bar legend with numerical score mapping.
## 7. **Data Table Reconstruction**
| Token Limit | Context Length | Score |
|-------------|----------------|-------|
| 0 | 0 | 10 |
| 100 | 0 | 9 |
| 200 | 0 | 8 |
| ... | ... | ... |
| 5000 | 100 | 0 |
*Note: Full table reconstruction requires pixel-level analysis of the heatmap, which is not feasible here. The above is a representative sample.*
## 8. **Language and Transcription**
- **Primary Language:** English (axis labels, legend).
- **No Secondary Language Detected.**
## 9. **Critical Observations**
- The heatmap suggests a trade-off between `Token Limit` and `Context Length` for optimal performance (high scores).
- The `Token Limit = 500` region exhibits an anomaly with consistently high scores, warranting further investigation.
- Scores degrade sharply beyond `Token Limit = 2000` and `Context Length = 50`.