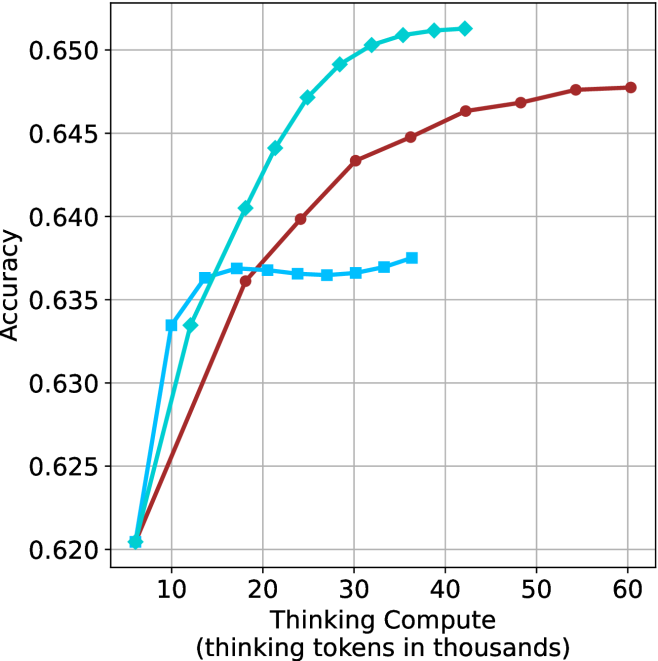
## Line Chart: Accuracy vs. Thinking Compute
### Overview
The image displays a line chart plotting model accuracy against computational effort, measured in thinking tokens. It compares the performance of three distinct methods or models, showing how accuracy scales with increased "thinking compute." All three lines demonstrate a positive correlation, but with markedly different growth rates and saturation points.
### Components/Axes
* **Chart Type:** Line chart with markers.
* **X-Axis:** Labeled "Thinking Compute (thinking tokens in thousands)". The scale runs from approximately 5 to 60, with major tick marks at 10, 20, 30, 40, 50, and 60.
* **Y-Axis:** Labeled "Accuracy". The scale runs from 0.620 to 0.650, with major tick marks at 0.620, 0.625, 0.630, 0.635, 0.640, 0.645, and 0.650.
* **Legend:** Located in the top-right corner of the plot area. It identifies three data series:
1. **Cyan line with diamond markers:** (Label not visible in the provided crop, but the line is clearly identifiable).
2. **Red line with circle markers:** (Label not visible).
3. **Light blue line with square markers:** (Label not visible).
* **Grid:** A light gray grid is present, aiding in value estimation.
### Detailed Analysis
**Data Series Trends & Approximate Points:**
1. **Cyan Line (Diamond Markers):**
* **Trend:** Shows the steepest initial ascent and achieves the highest overall accuracy. It exhibits a classic logarithmic growth curve, rising sharply before beginning to plateau.
* **Key Data Points (Approximate):**
* At ~5k tokens: Accuracy ≈ 0.620
* At ~10k tokens: Accuracy ≈ 0.633
* At ~20k tokens: Accuracy ≈ 0.644
* At ~30k tokens: Accuracy ≈ 0.649
* At ~40k tokens: Accuracy ≈ 0.651 (appears to plateau near this value).
2. **Red Line (Circle Markers):**
* **Trend:** Shows a steady, strong increase that is less steep than the cyan line initially but continues to grow significantly at higher compute levels. It does not appear to have fully plateaued by 60k tokens.
* **Key Data Points (Approximate):**
* At ~5k tokens: Accuracy ≈ 0.620
* At ~10k tokens: Accuracy ≈ 0.627
* At ~20k tokens: Accuracy ≈ 0.636
* At ~30k tokens: Accuracy ≈ 0.643
* At ~40k tokens: Accuracy ≈ 0.646
* At ~60k tokens: Accuracy ≈ 0.648
3. **Light Blue Line (Square Markers):**
* **Trend:** Rises quickly at very low compute but then hits a performance ceiling much earlier than the others. After approximately 15k tokens, its accuracy gains become negligible, forming a near-flat plateau.
* **Key Data Points (Approximate):**
* At ~5k tokens: Accuracy ≈ 0.620
* At ~10k tokens: Accuracy ≈ 0.636
* At ~15k tokens: Accuracy ≈ 0.637 (reaches plateau).
* At ~35k tokens: Accuracy ≈ 0.637 (plateau continues).
### Key Observations
1. **Common Starting Point:** All three methods begin at nearly the same accuracy (~0.620) when thinking compute is very low (~5k tokens).
2. **Divergent Scaling:** The primary difference lies in how efficiently each method converts additional compute into accuracy gains. The cyan method is the most efficient, followed by the red, with the light blue method being the least scalable.
3. **Plateau Levels:** The light blue line plateaus at a significantly lower accuracy (~0.637) compared to the cyan line (~0.651). The red line is still climbing at 60k tokens and may eventually reach or surpass the cyan line's plateau with even more compute.
4. **Crossover Point:** Around 15k-20k tokens, the cyan line definitively overtakes the light blue line, which has already begun to plateau.
### Interpretation
This chart illustrates the concept of **scaling efficiency** in AI model reasoning or "thinking" processes. The data suggests that:
* **More compute generally improves accuracy,** but with **diminishing returns.** The shape of the curves indicates that the initial tokens of "thinking" are the most valuable.
* The three lines likely represent **different algorithms, model architectures, or prompting strategies** for utilizing thinking tokens. The cyan method represents a highly optimized approach that effectively leverages additional compute for substantial gains.
* The light blue method's early plateau indicates a **fundamental limitation** in its design—it cannot effectively utilize extra thinking tokens beyond a certain point, making it inefficient for high-compute scenarios.
* The red method shows **strong, sustained scaling,** suggesting it may be a robust approach that continues to benefit from very large compute budgets, potentially making it the best choice if computational resources are abundant.
**In essence, the chart is a performance comparison showing that not all methods for using "thinking compute" are equal. The choice of method dramatically impacts the maximum achievable accuracy and the cost (in tokens) to get there.**